Fig. 4.
Download original image
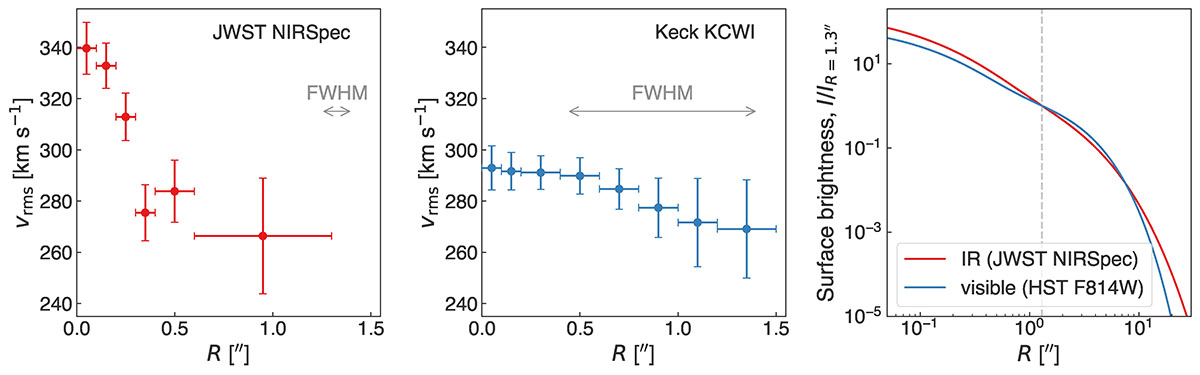
Measured values of vrms for RX J1131−1231 in radial annuli from the JWST NIRSpec (left-hand panel, the same ones shown in Fig. 2) and Keck KCWI (middle panel). Both of these measurements marginalize over the same choices of template libraries, namely the Indo-US and the XSL DR3, in addition to separate choice combinations for polynomial orders and fitted wavelength range. The arrows in these panels illustrate the size of the PSF FWHM for each case (![]() for JWST-NIRSpec and
for JWST-NIRSpec and ![]() for Keck-KCWI): the higher resolution of the JWST-NIRSpec data enabled the identification of the sharp rise of the velocity dispersion profile in the center. The right-hand panel illustrates the 1D surface brightness profile in optical (blue line) and in the IR (red line). The optical light profile was extracted from double Sérsic fitting by Shajib et al. (2023) from a large cutout that encapsulates the full extent of the galaxy in the HST F814W imaging (which corresponds to a pivot wavelength of 6208 Å in the lens rest-frame). The IR light profile was extracted from the double Sérsic light profile fitted as part of the lens modeling done with a 2D image obtained from the NIRSpec datacube by summing within the wavelength range 8700–8800 Å in the lens rest-frame. The surface brightness profiles are normalized by the corresponding amplitudes at
for Keck-KCWI): the higher resolution of the JWST-NIRSpec data enabled the identification of the sharp rise of the velocity dispersion profile in the center. The right-hand panel illustrates the 1D surface brightness profile in optical (blue line) and in the IR (red line). The optical light profile was extracted from double Sérsic fitting by Shajib et al. (2023) from a large cutout that encapsulates the full extent of the galaxy in the HST F814W imaging (which corresponds to a pivot wavelength of 6208 Å in the lens rest-frame). The IR light profile was extracted from the double Sérsic light profile fitted as part of the lens modeling done with a 2D image obtained from the NIRSpec datacube by summing within the wavelength range 8700–8800 Å in the lens rest-frame. The surface brightness profiles are normalized by the corresponding amplitudes at ![]() (vertical dashed line). For kinematic modeling of the NIRSpec kinematics, we use a stitched light profile that transitions from the IR light profile at
(vertical dashed line). For kinematic modeling of the NIRSpec kinematics, we use a stitched light profile that transitions from the IR light profile at ![]() to the optical light profile shape at
to the optical light profile shape at ![]() .
.
Current usage metrics show cumulative count of Article Views (full-text article views including HTML views, PDF and ePub downloads, according to the available data) and Abstracts Views on Vision4Press platform.
Data correspond to usage on the plateform after 2015. The current usage metrics is available 48-96 hours after online publication and is updated daily on week days.
Initial download of the metrics may take a while.