Fig. 5.
Download original image
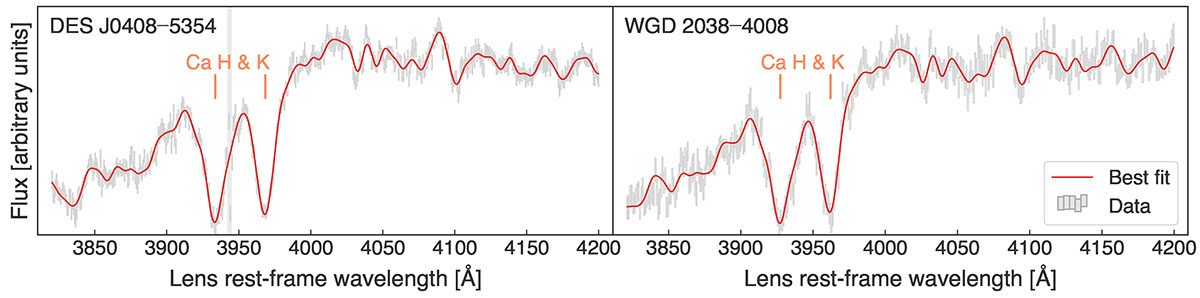
VLT-MUSE spectra and kinematics fits with PPXF for DES J0408−5354 (left-hand panel) and WGD 2038−4008 (right-hand panel). The gray rectangles illustrate the data with the height representing the 1σ uncertainty and the width representing the wavelength-pixel size. The red line illustrates the best-fit model. The principal spectral features probing the kinematics are the Ca H & K absorption lines marked with vertical orange lines. The gray-shaded region on the left-hand panel represents the wavelength range excluded from the fit.
Current usage metrics show cumulative count of Article Views (full-text article views including HTML views, PDF and ePub downloads, according to the available data) and Abstracts Views on Vision4Press platform.
Data correspond to usage on the plateform after 2015. The current usage metrics is available 48-96 hours after online publication and is updated daily on week days.
Initial download of the metrics may take a while.