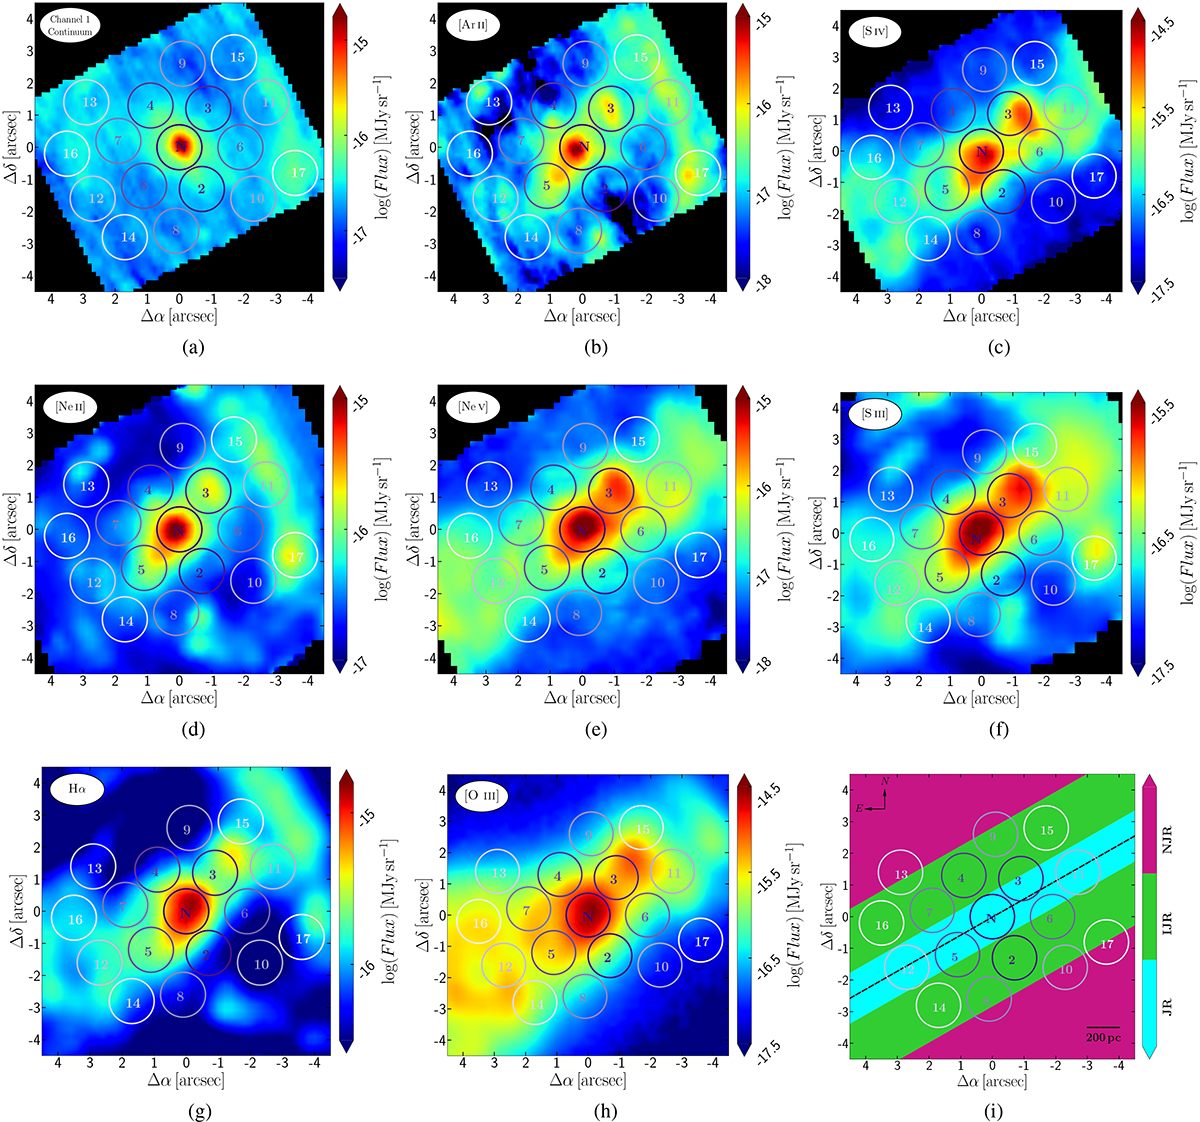
Fig. 1.
Download original image
Apertures chosen to extract spectra from the spectroscopic images of NGC 5728. These are depicted in different shades of purple from deep purple being the nuclear aperture “N” to pale lilac in increasing distance, also noted with numbers. The apertures are drawn over (a) the continuum in Channel 1 of MIRI, extracted in the rest-frame range of 5.90–6.05μm and over [Ar II]λ7 μm, [S IV]λ10.5 μm, [Ne II]λ12.8 μm, [Ne V]λ14.9 μm, [S III]λ18.7 μm, Hα, and [O III]λ5007Å (b–h) line emission maps with the stellar continuum subtracted. Panel (i) presents a schematic illustration of the adopted jet axis together with the three color-shaded regions used to group the apertures (see Sect. 2.3). These regions are defined by the projected vertical distance from the jet axis, relative to the aperture radius: JR (innermost, cyan) includes apertures within one radius (nuclear and/or jet regions); IJR (intermediate, lime green) covers one to two radii (intermediate jet-affected regions); and NJR (outermost, magenta) includes apertures beyond two radii (non-jet or star-forming regions). The multiwavelength data are aligned based on the astrometry of the nucleus.
Current usage metrics show cumulative count of Article Views (full-text article views including HTML views, PDF and ePub downloads, according to the available data) and Abstracts Views on Vision4Press platform.
Data correspond to usage on the plateform after 2015. The current usage metrics is available 48-96 hours after online publication and is updated daily on week days.
Initial download of the metrics may take a while.