Fig. 6.
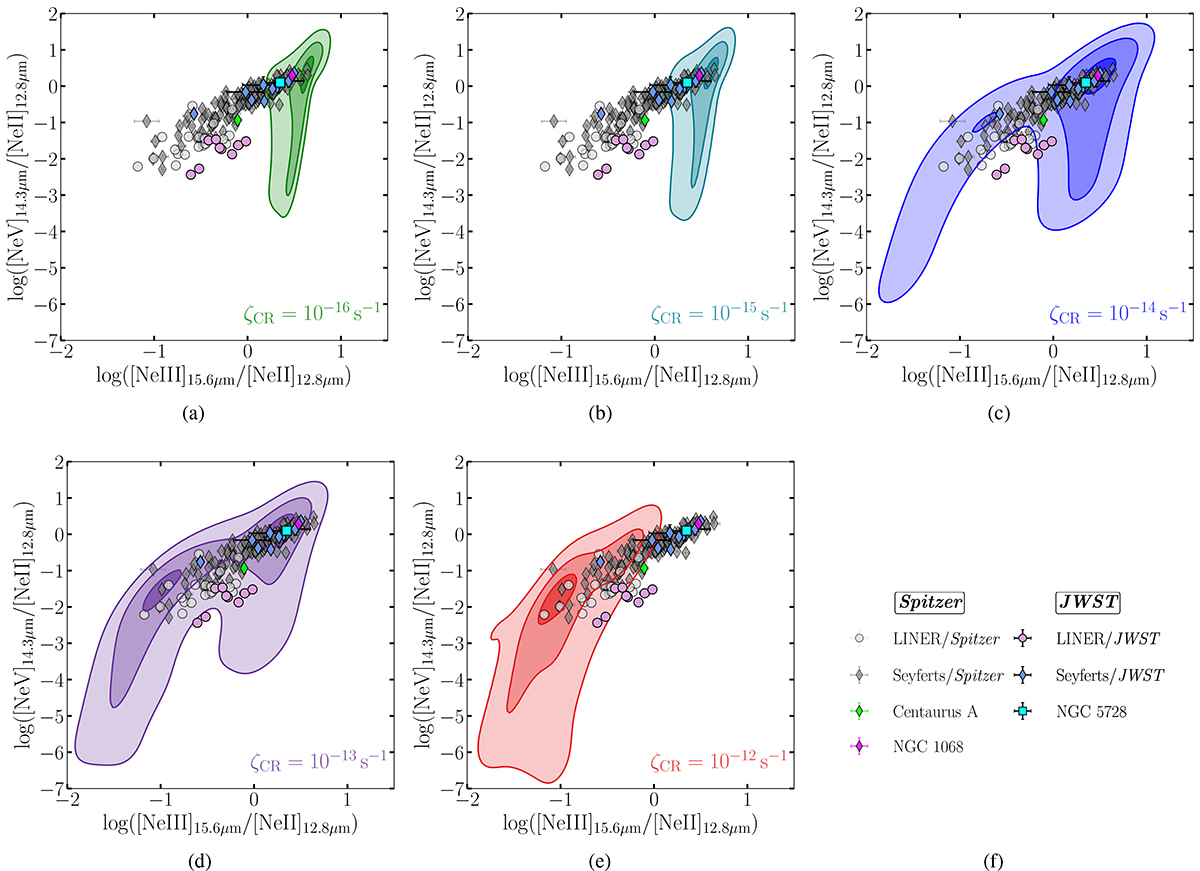
Download original image
Diagnostic diagrams depicting the area covered by AGN models with solar abundances for −3.5 ≤ log U ≤ −1.5 and for 0 ≤ log nH ≤ 4. The solid contour lines map regions containing 10%, 50%, and 90% of the models for ζCR = 10−16 s−1, 10−15 s−1, 10−14 s−1, 10−13 s−1, and 10−12 s−1, from left to right in green-, teal-, blue-, purple-, and red-colored contours, respectively. In the background are archival Spitzer/IRS measurements of Seyfert and LINER nuclei (Dudik et al. 2007, 2009; Goulding & Alexander 2009; Tommasin et al. 2008, 2010; Pereira-Santaella et al. 2010; Fernández-Ontiveros et al. 2016, 2021), along with recent nuclear line ratios from JWST/MIRI observations from the literature (Pereira-Santaella et al. 2022; Álvarez-Márquez et al. 2023; Armus et al. 2023; Alonso Herrero et al. 2024; Zhang et al. 2024; Hernandez et al. 2025; Goold et al. 2024; Hermosa Muñoz et al. 2025, Goold et al. in prep., Fernández-Ontiveros et al. in prep.)
Current usage metrics show cumulative count of Article Views (full-text article views including HTML views, PDF and ePub downloads, according to the available data) and Abstracts Views on Vision4Press platform.
Data correspond to usage on the plateform after 2015. The current usage metrics is available 48-96 hours after online publication and is updated daily on week days.
Initial download of the metrics may take a while.