Fig. C.1.
Download original image
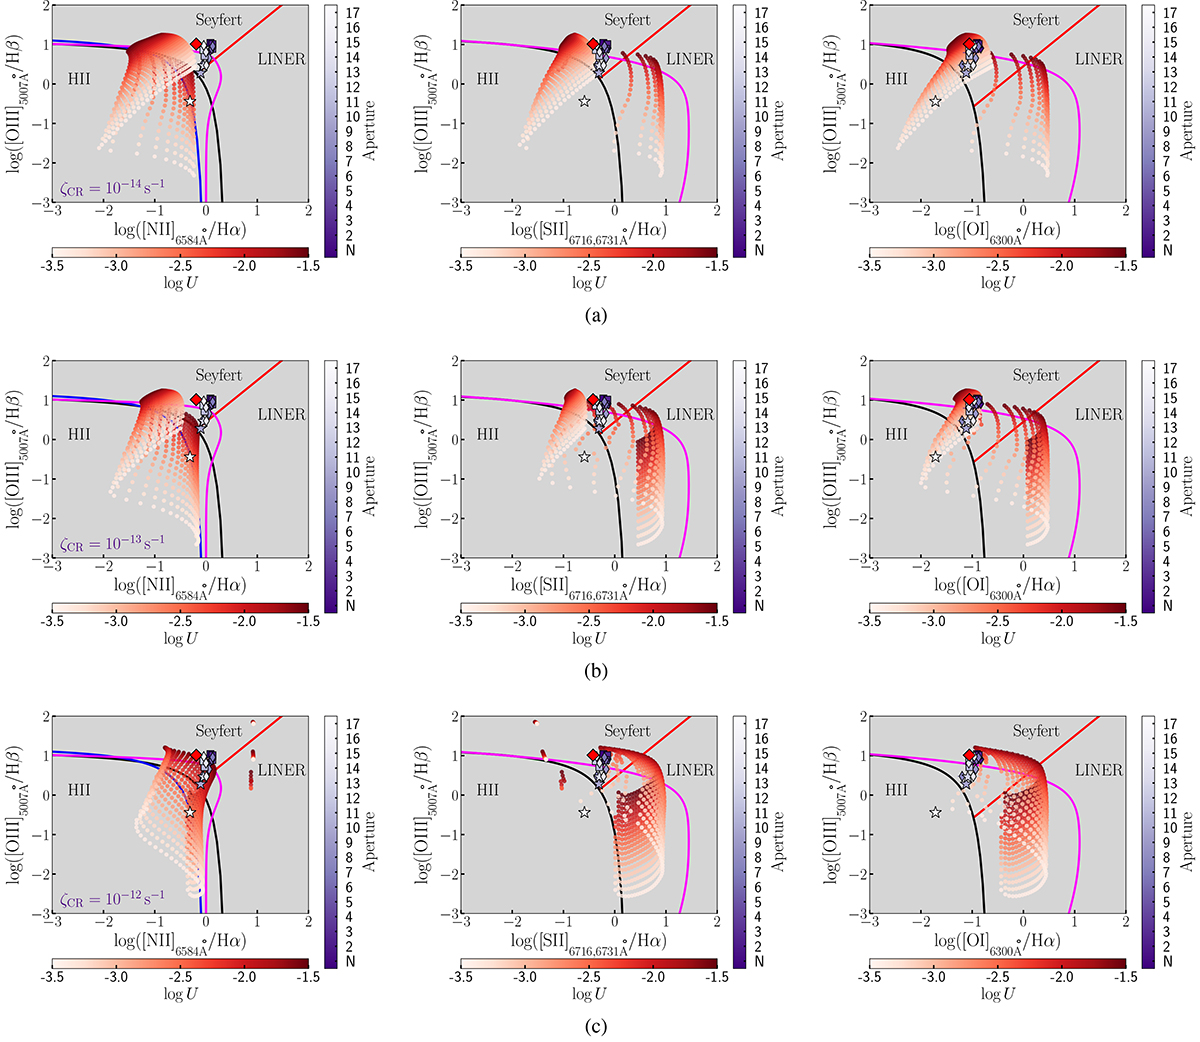
BPT diagrams comparing AGN photoionization models with observations from selected apertures in NGC 5728 (Fig. 1). The BPT diagrams for [N II], [S II], and [O I] are shown on the left, middle, and right, respectively. The different shades of purple, ranging from deep purple to pale lilac and/or white, represent the increasing distance from the nucleus, as also indicated by numbers, with "N" denoting the nuclear aperture. The different shapes-square, thin diamond, and star-represent the nucleus and/or jet impacted, intermediate, and distant areas, respectively. The different shades from white to deep red represent the range of ionization parameter values, −3.5 ≤ log U ≤ −1.5. The red diamonds represent the measured line ratios for the photoionization-dominated Seyfert 2 nucleus in NGC 1320. The Kewley, Kauffmann, Schawinski, and Koutsoumpou (SFζ) lines correspond to the solid black, blue, red, and magenta lines, respectively. The panels from top to bottom correspond to ζCR = 10−14 s−1, 10−13 s−1, and 10−12 s−1, respectively.
Current usage metrics show cumulative count of Article Views (full-text article views including HTML views, PDF and ePub downloads, according to the available data) and Abstracts Views on Vision4Press platform.
Data correspond to usage on the plateform after 2015. The current usage metrics is available 48-96 hours after online publication and is updated daily on week days.
Initial download of the metrics may take a while.