Fig. D.2.
Download original image
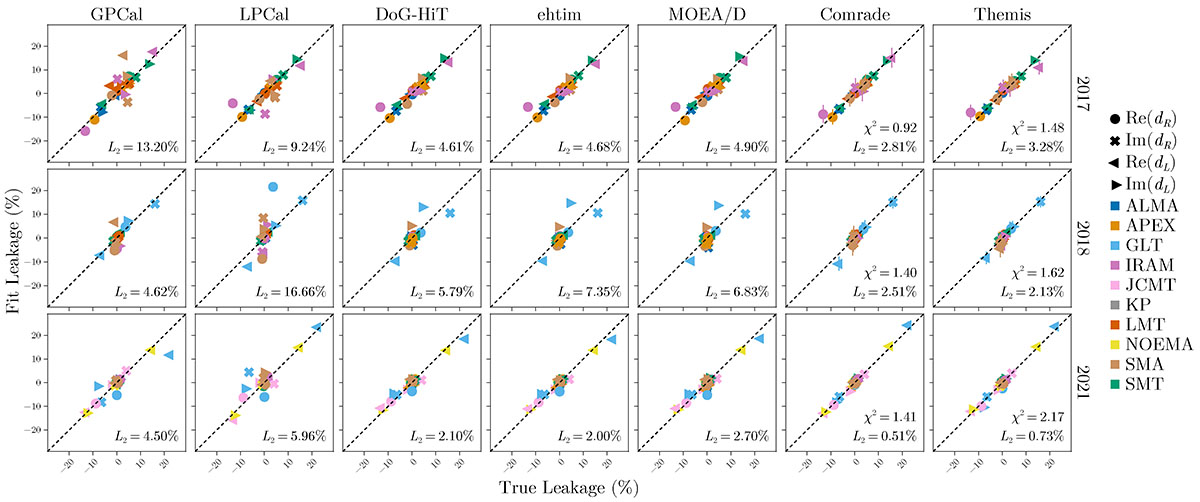
D-term recovery results of blinded GRMHD synthetic data from each polarized imaging method (columns) and year (rows). The x-axis of each plot is the true leakage, and the y-axis is the measured leakage. Perfect recovery means that all points should live on the y = x line. The total L2 difference between the ground truth and recovered leakage averaged over all stations is shown in the bottom right of each plot. For the Bayesian methods, we also show a χ2 value computed as the square difference between the true value and the recovered leakage divided by the variance of the posterior estimate. For the Bayesian methods, the points denote the posterior median leakage, and error bars show the 95% credible interval about the median.
Current usage metrics show cumulative count of Article Views (full-text article views including HTML views, PDF and ePub downloads, according to the available data) and Abstracts Views on Vision4Press platform.
Data correspond to usage on the plateform after 2015. The current usage metrics is available 48-96 hours after online publication and is updated daily on week days.
Initial download of the metrics may take a while.