Fig. 6.
Download original image
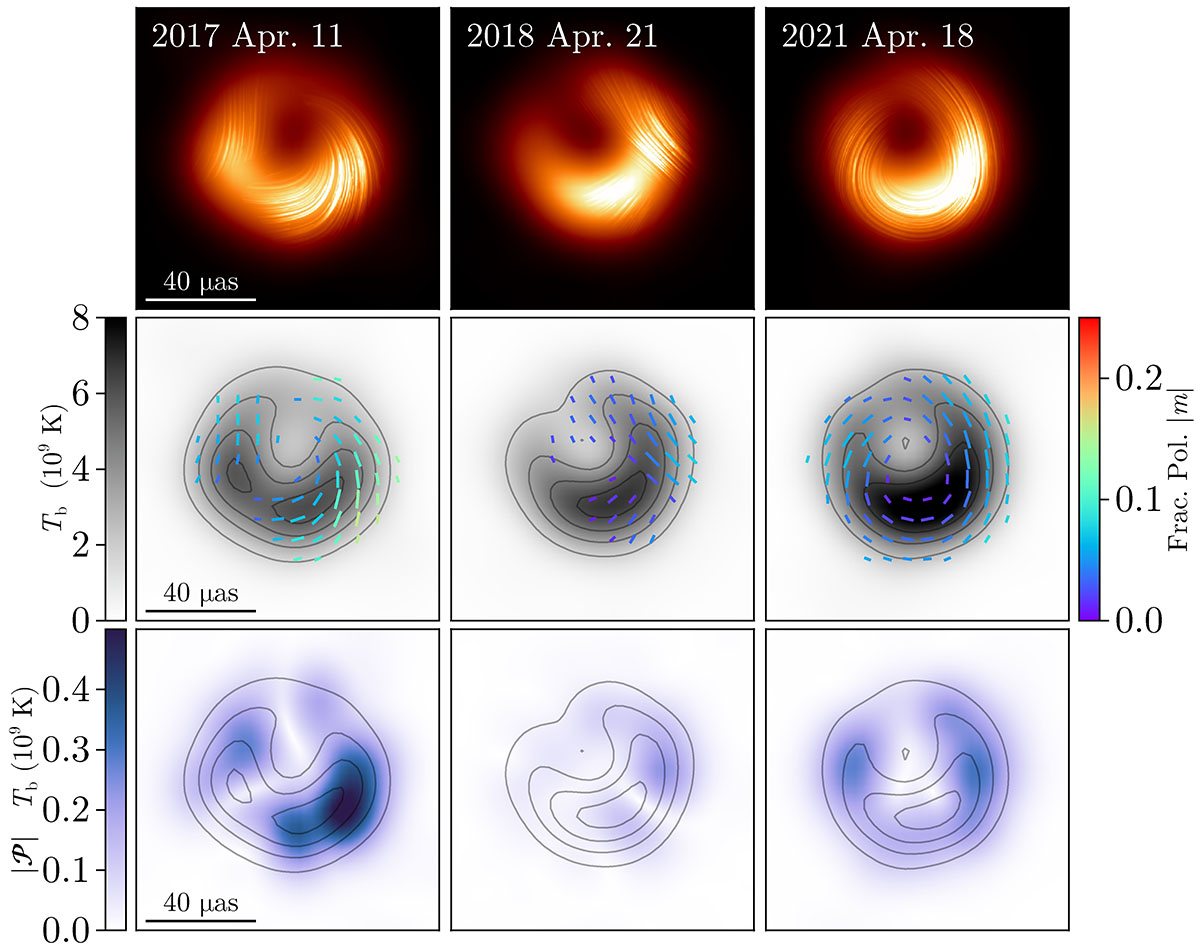
Fiducial images for 2017 (band 3), 2018 (bands 3 and 4), and 2021 (bands 3 and 4). The images were produced by averaging the reconstructions over the methods described in Sect. 3. Each method’s image reconstruction has been blurred to match the resolution of the representative LPCAL image. Top row: Polarization ‘field lines’ overlaid on the total intensity image. Second row: Total intensity image in grey scale with the contours showing the 22.5%, 45%, 67.5%, and 90% peak brightness levels, overlaid with polarization ticks. The polarization ticks indicate the EVPA, the tick length is proportional to the linear polarization intensity, and their colour indicates the linear polarization fraction. Polarization ticks are only shown in regions where the total intensity is > 10% of the maximum brightness and the linear polarization brightness is > 10% of the peak linear polarized brightness. Bottom row: Total linear polarized brightness, |𝒫|.
Current usage metrics show cumulative count of Article Views (full-text article views including HTML views, PDF and ePub downloads, according to the available data) and Abstracts Views on Vision4Press platform.
Data correspond to usage on the plateform after 2015. The current usage metrics is available 48-96 hours after online publication and is updated daily on week days.
Initial download of the metrics may take a while.