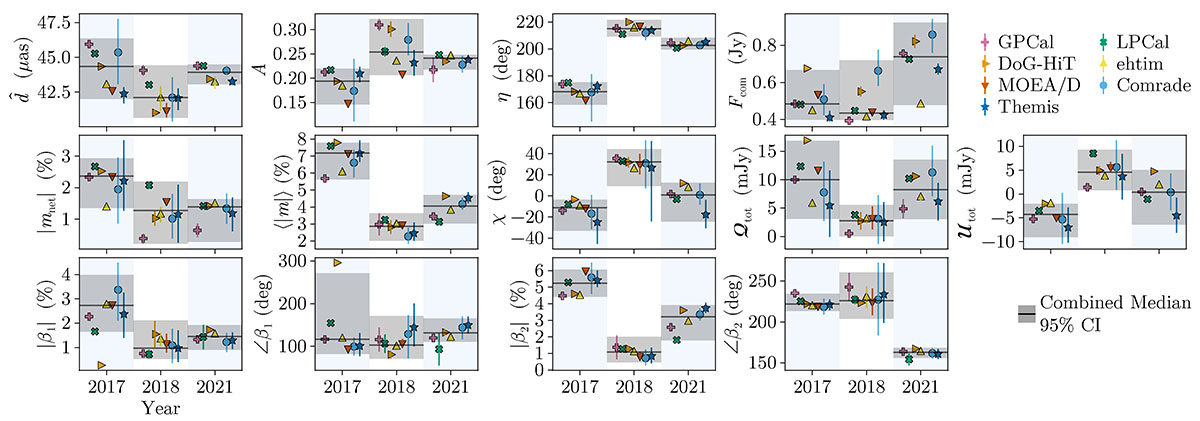
Fig. 7.
Download original image
Extracted parameters of M87* across the three observations and averaged over band 3 and band 4. Each panel shows the results from April 11, 2017, April 21, 2018, and April 18, 2021. For the non-Bayesian methods, the error bars show the spread between the high- and low-band estimates and are not a measure of the statistical uncertainty of the image reconstruction. The error bars for the Bayesian methods show the 95% credible interval around the median and measure the statistical uncertainty of the reconstructions due to thermal noise, instrumental effects, incomplete coverage, and frequency dependence. The solid black line is the median, and the grey band is the 95-percentile range from all image reconstructions, with each method weighted inversely to the number of images they produced. Note that each image reconstruction has been blurred to match the resolution of the LPCAL reconstruction before the parameters were estimated.
Current usage metrics show cumulative count of Article Views (full-text article views including HTML views, PDF and ePub downloads, according to the available data) and Abstracts Views on Vision4Press platform.
Data correspond to usage on the plateform after 2015. The current usage metrics is available 48-96 hours after online publication and is updated daily on week days.
Initial download of the metrics may take a while.