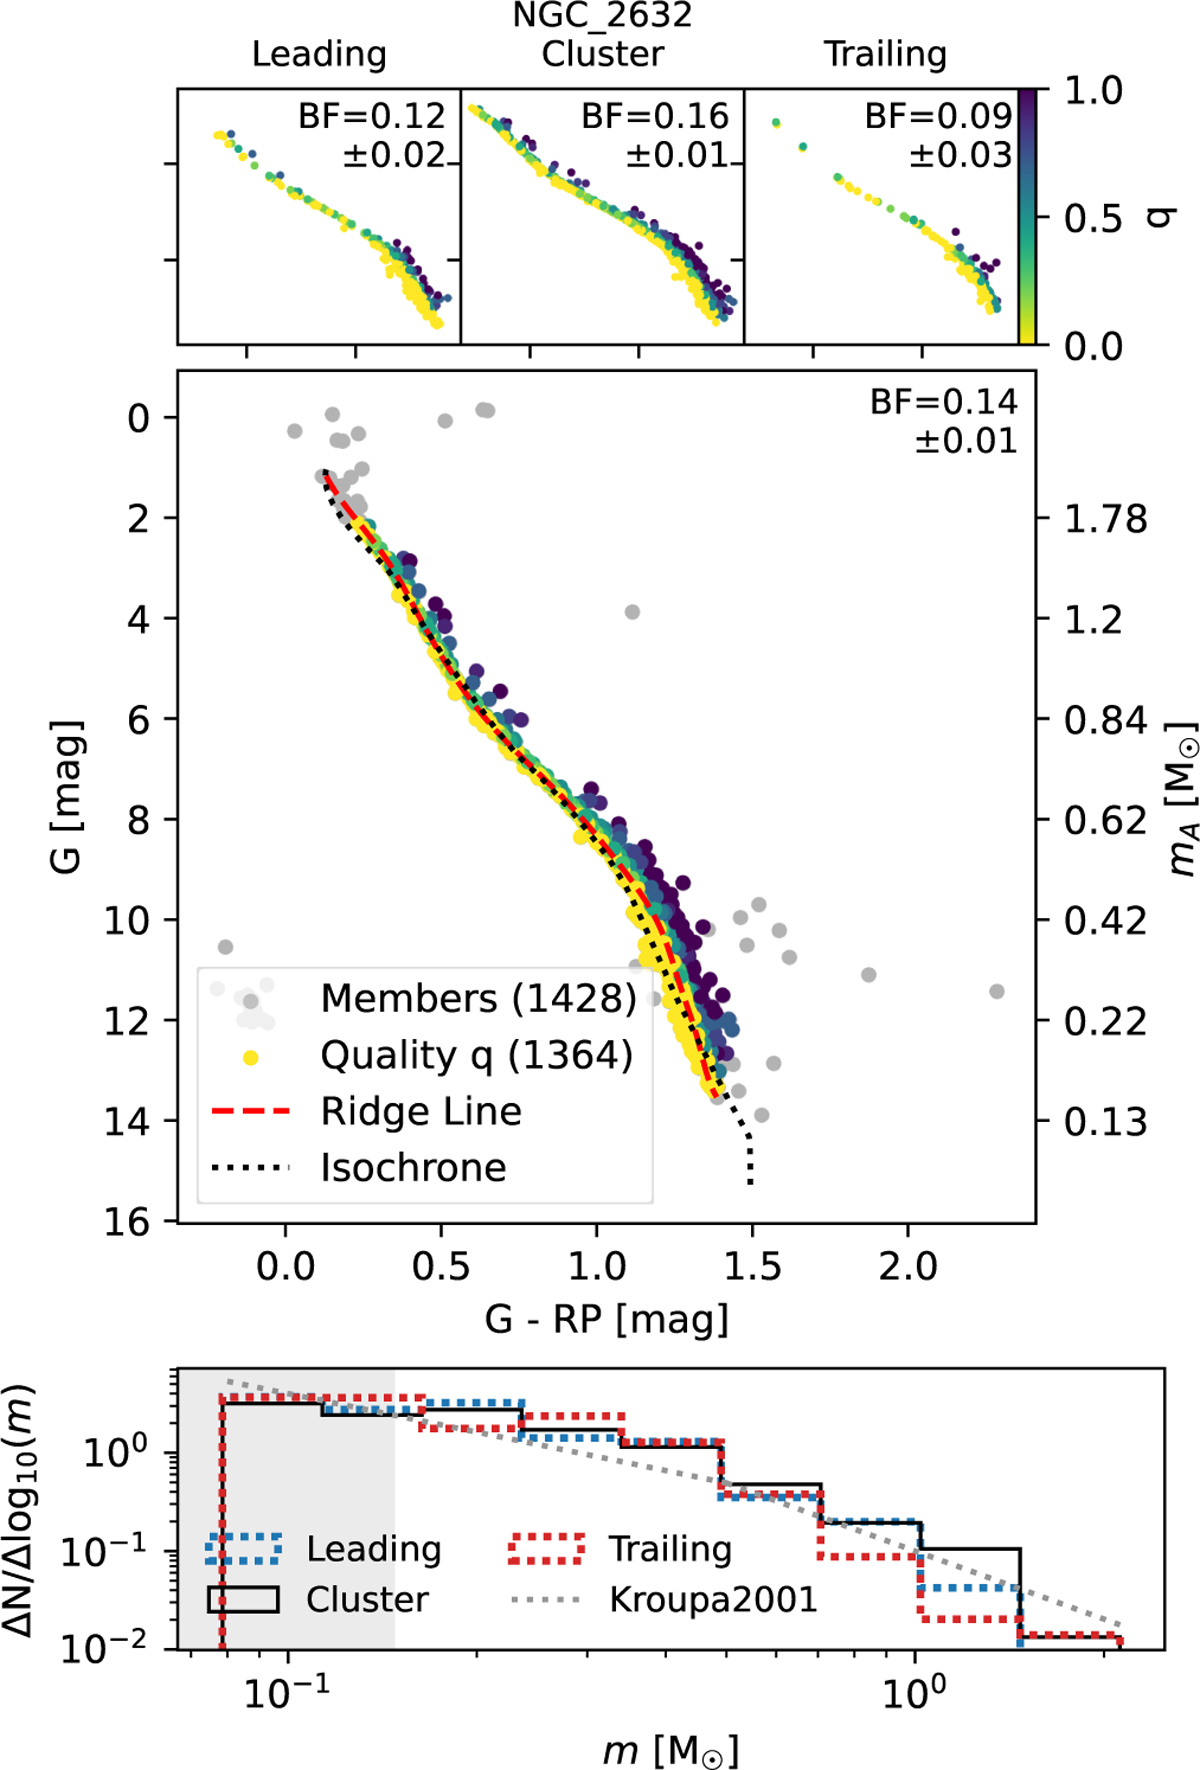
Fig. A.2
Download original image
Demonstration of BF calculation for NGC 2632. (Top row) Absolute CMDs for leading tail, cluster, and trailing tail. (Middle row) Absolute CMD for all stars coloured according to the mass ratio (q). The isochrone (dotted grey curve) and main-sequence ridge line (dashed red curve) are shown for reference. (Bottom row) The MF of the visible members of the cluster and tidal tail. Kroupa (2001) IMF is shown for reference. The lower limit of credible mass estimates is indicated by the grey-shaded region.
Current usage metrics show cumulative count of Article Views (full-text article views including HTML views, PDF and ePub downloads, according to the available data) and Abstracts Views on Vision4Press platform.
Data correspond to usage on the plateform after 2015. The current usage metrics is available 48-96 hours after online publication and is updated daily on week days.
Initial download of the metrics may take a while.