Fig. A.8
Download original image
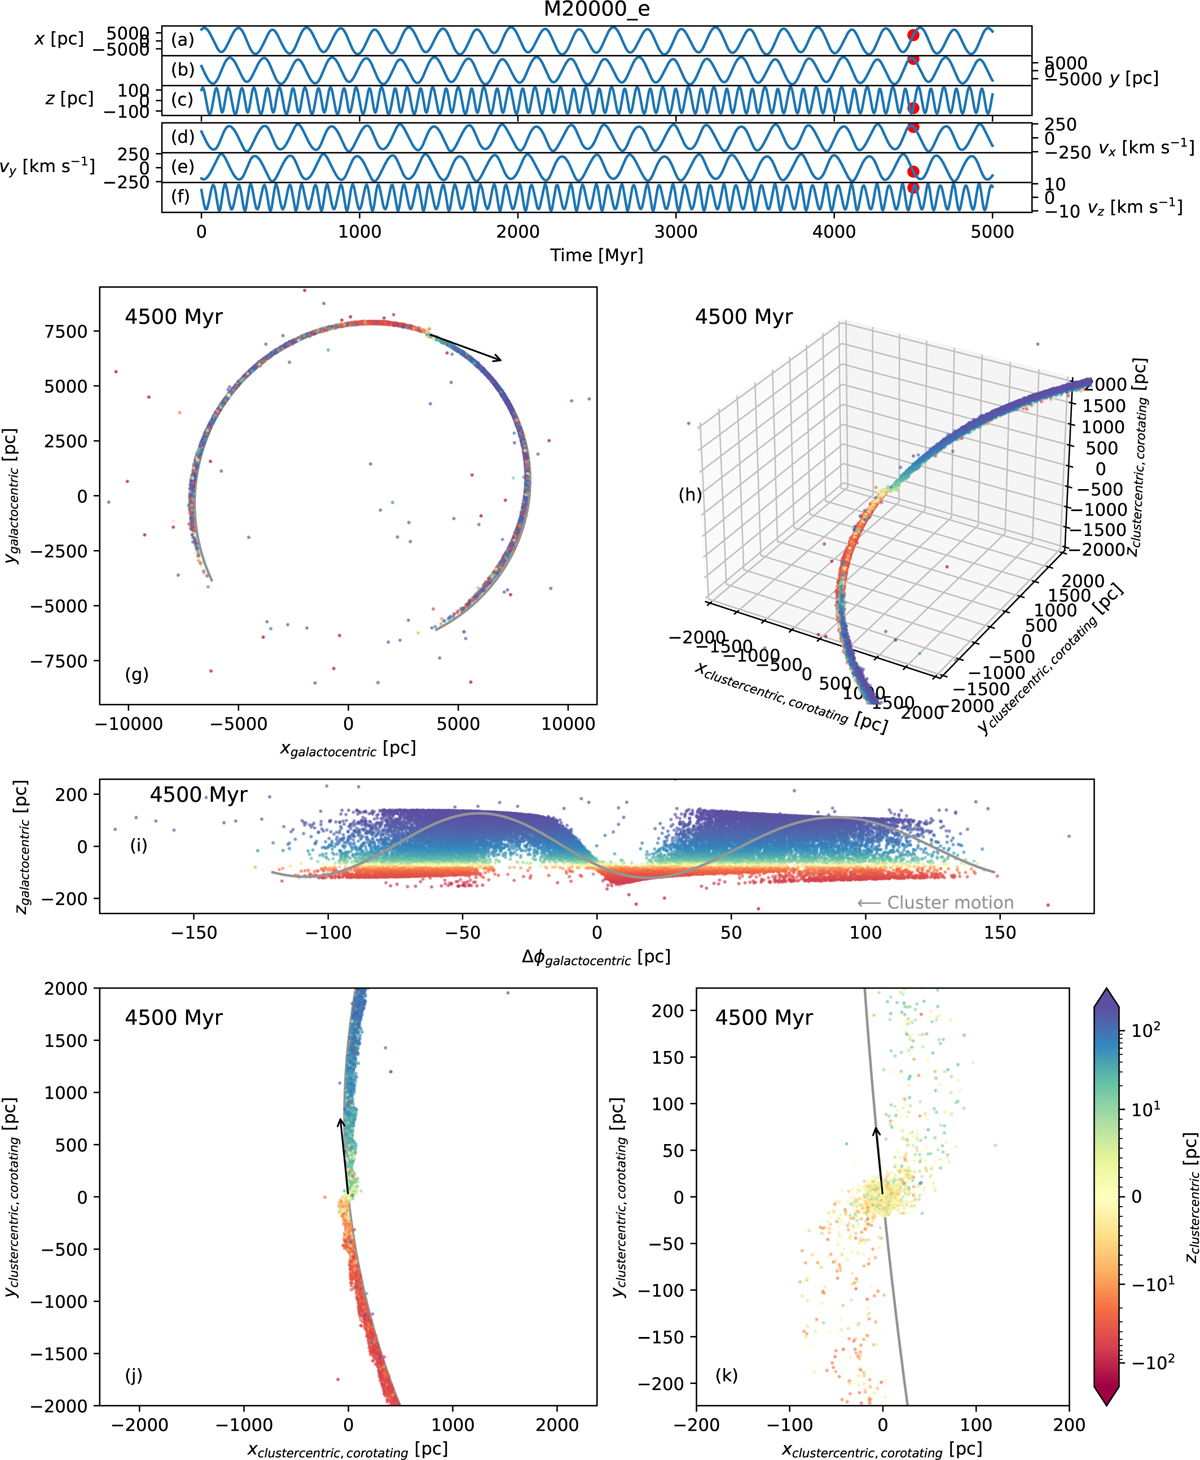
A screenshot of the movies available as online material (for models M1000, M20000, and M20000_e). The (a) to (f) panels show the total evolution of Galactocentric position (x, y, z) and velocities (vx, vy, vz) with time. The points at a given time of the movie are marked by red dots. (g) The Galactocentric distribution of all particles in the simulations. (h) The 3D distribution of particles in the corotating frame and with the origin at the cluster centre (i.e. the clustercentric corotating frame). (i) The distribution of Δφgalactocentric with zgalactocentric. (j) The XY distribution of particles in the clustercentric corotating frame. (k) Same as panel (j) but zoomed in near the cluster centre. The points in panel (g) to (k) are coloured according to their clustercentric z co-ordinate, and the time of the snapshot is written in the corner. The cluster orbit and velocity are shown as the grey curve and black arrow, respectively.
Current usage metrics show cumulative count of Article Views (full-text article views including HTML views, PDF and ePub downloads, according to the available data) and Abstracts Views on Vision4Press platform.
Data correspond to usage on the plateform after 2015. The current usage metrics is available 48-96 hours after online publication and is updated daily on week days.
Initial download of the metrics may take a while.