Fig. 2
Download original image
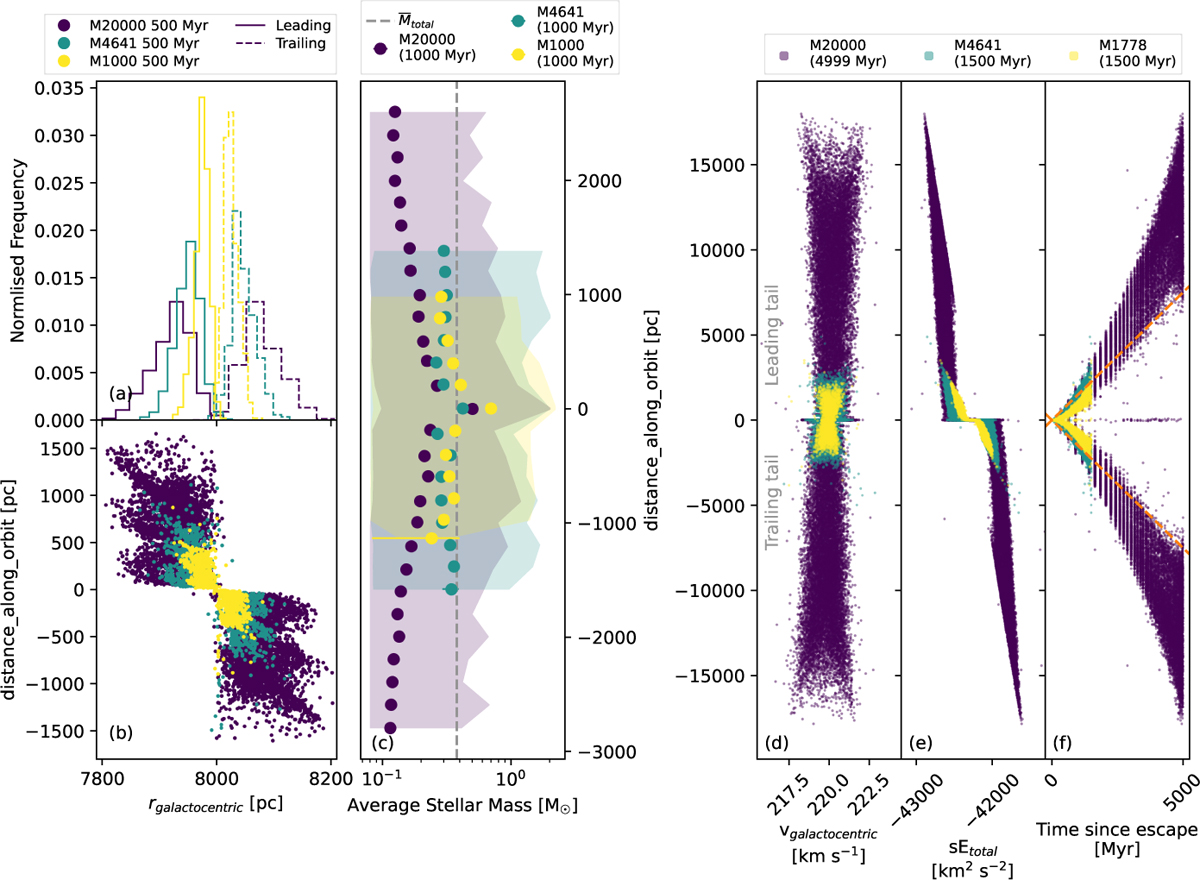
Plots regarding the amplitude of the Ƨ shape (a–b), average mass along the tail (c), and kinematics of the tail (d–f). (a) rgalactocentric histogram for the M20000, M4641 and M1000 models at an age of 500 Myr. The leading (solid lines) and trailing (dashed lines) are shown separately. (b) The distribution of distance_along_orbit with rgalactocentric for the same models in (a). The central 2Rtidal region is omitted while plotting the distributions in (a) and (b). (c) Average stellar mass as a function of distance_along_orbit in 200 pc bins for the models M20000, M4641 and M1000 (at an age of 1000 Myr). The shaded regions indicate 5-95 percentile values of the stellar masses. The dashed lines show the average mass of all stars in each simulation. (d–f) The variation in distance_along_orbit with vgalactocentric (d) total specific energy (e) and the time since escape (f) for M20000, M4641, and M1778 for their oldest snapshot. The dashed orange lines in panel f represent stars moving with a speed of 1.5 pc Myr−1 (= 1.47 km s−1) away from the cluster. Similar plots for M20000_e are given in Fig A.4.
Current usage metrics show cumulative count of Article Views (full-text article views including HTML views, PDF and ePub downloads, according to the available data) and Abstracts Views on Vision4Press platform.
Data correspond to usage on the plateform after 2015. The current usage metrics is available 48-96 hours after online publication and is updated daily on week days.
Initial download of the metrics may take a while.