Fig. 3
Download original image
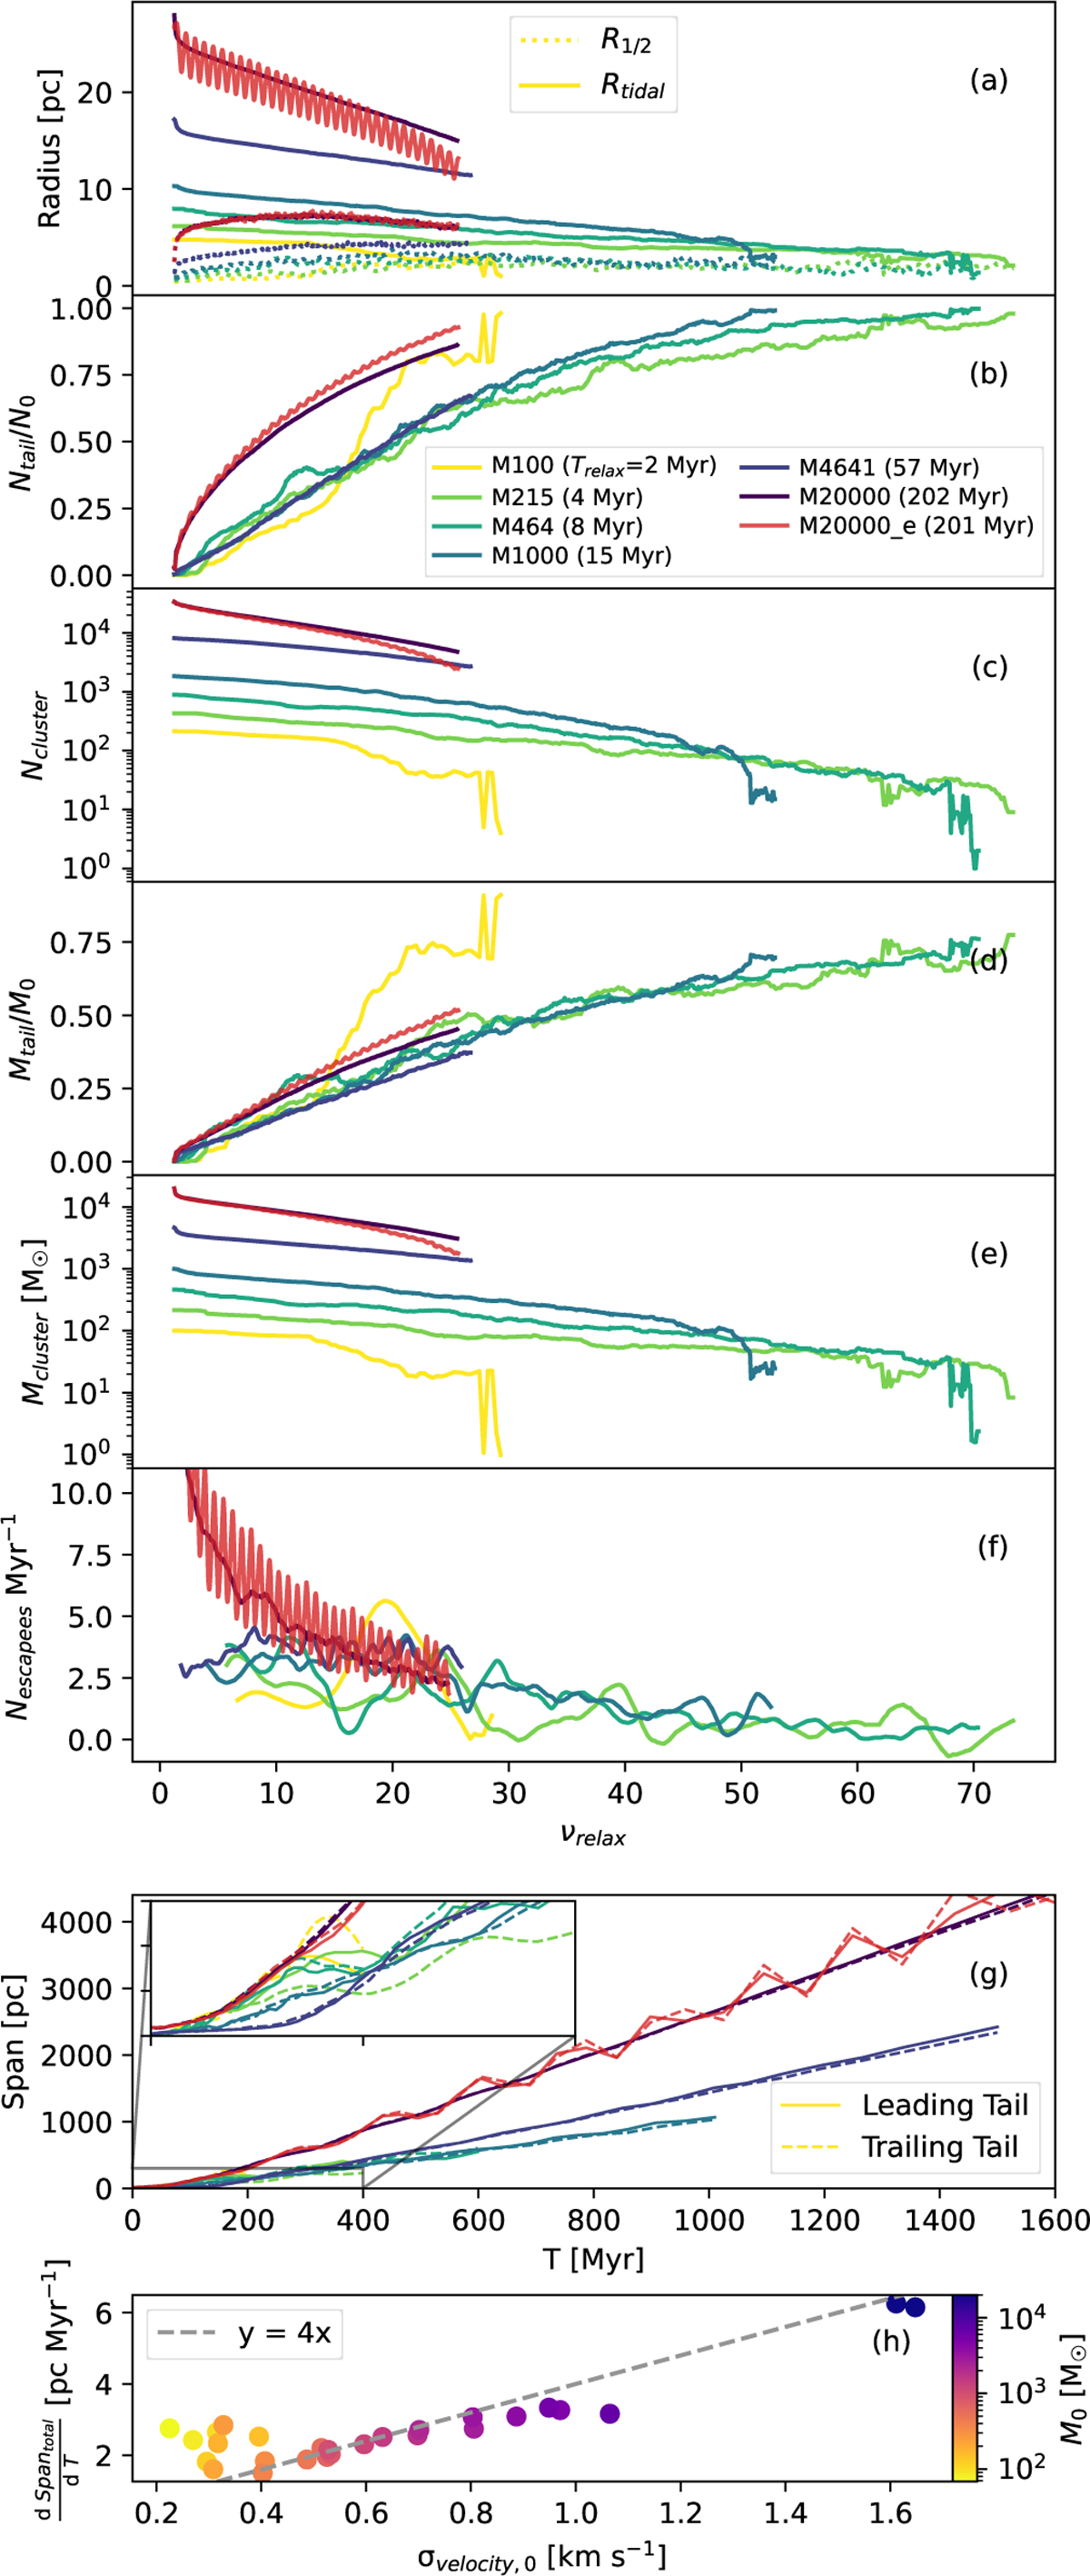
Evolution of tail and cluster parameters for various models. (a) The tidal radius (solid curve) and half mass radius (dotted curve). (b) Number of stars in the tail normalised by the total number of stars at the beginning. (c) Number of stars in the cluster. (d) Mass of the tail normalised by the total mass at the beginning. (e) Mass of the cluster. (f) Number of averaged escapees every million years. (g) Span of the leading (solid curves) and trailing (dashed curves) tail. (h) Variation in the rate of increase in the total tail span (spantotal) with the initial velocity dispersion (σvelocity,0) of the clusters, coloured according to the initial mass (M0). See Figure A.3 for comparison with the analytical formulae.
Current usage metrics show cumulative count of Article Views (full-text article views including HTML views, PDF and ePub downloads, according to the available data) and Abstracts Views on Vision4Press platform.
Data correspond to usage on the plateform after 2015. The current usage metrics is available 48-96 hours after online publication and is updated daily on week days.
Initial download of the metrics may take a while.