Fig. 4
Download original image
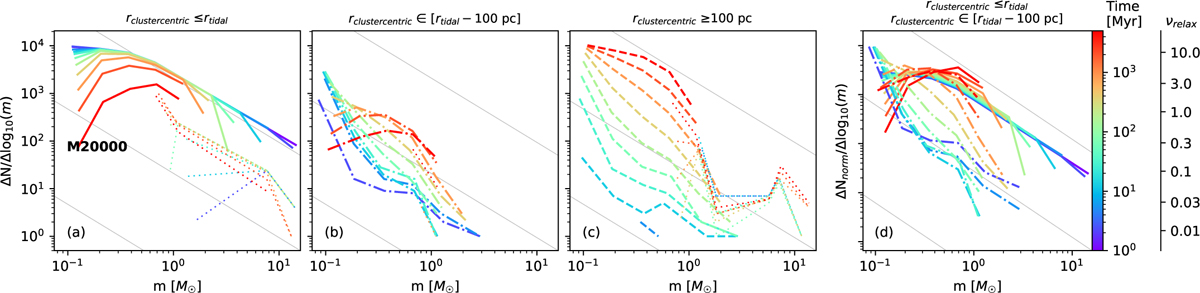
Evolution of the MF for the cluster, near-tail and far-tail for the M20000 model (M4641 and M1000 model are shown in Figure A.5). (a) Evolution of the MF of the cluster. The colours represent the cluster age (blue: younger, red: older). The solid lines show the MFs of the non-degenerate (ignoring white dwarfs, neutron stars, and black holes) population. (b) Evolution of the MF within the observationally detectable near-tail region. The non-degenerate MF is shown using dash-dotted lines. (c) Evolution of the MF in the far-tails region. The non-degenerate MF is shown using dashed lines. (d) Normalised (scaled by the total number of stars) MF of the cluster (solid lines) and near-tail (dash-dotted lines). The dotted lines show the MFs of degenerate stars in (a–c) panels. Grey lines with the Salpeter (1955) IMF slope (Γ=−1.35) are shown as for reference.
Current usage metrics show cumulative count of Article Views (full-text article views including HTML views, PDF and ePub downloads, according to the available data) and Abstracts Views on Vision4Press platform.
Data correspond to usage on the plateform after 2015. The current usage metrics is available 48-96 hours after online publication and is updated daily on week days.
Initial download of the metrics may take a while.