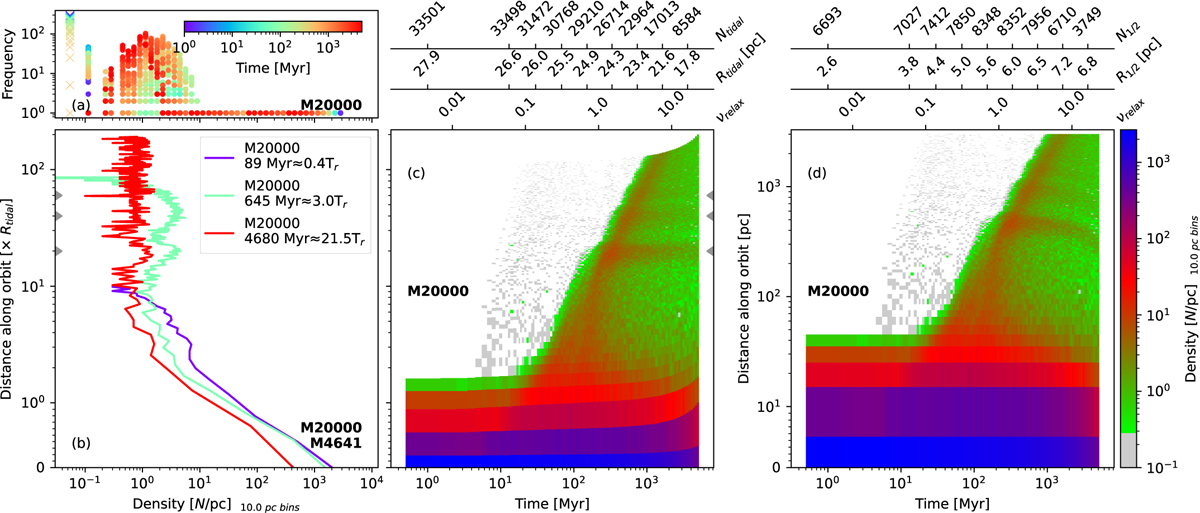
Fig. 5
Download original image
Linear number density (N/pc) within the cluster tails as calculated by binning distance_along_orbit every 10 pc. (a) Frequency of the number density in all bins coloured according to the cluster age. The frequency of empty bins is shown by crosses at the left end of the plot. (b) The number density for M20000 (solid lines) and M4641 (dotted lines) at various ages. (c) Evolution of the tail density in M20000 as a function of distance_along_orbit (as a multiple of Rtidal). (d) Density variation in M20000 as a function of the distance_along_orbit (in pc). The grey colour denotes the region with <3 particles per bin. The vrelax, R1/2, Rtidal, N1/2, and Ntidal are indicated for reference. The 20, 40, and 60Rtidal are marked by grey triangles as visual guides near overdensities. Similar plots for M2154 and M20000_e are given in Figure A.6.
Current usage metrics show cumulative count of Article Views (full-text article views including HTML views, PDF and ePub downloads, according to the available data) and Abstracts Views on Vision4Press platform.
Data correspond to usage on the plateform after 2015. The current usage metrics is available 48-96 hours after online publication and is updated daily on week days.
Initial download of the metrics may take a while.