Fig. 6
Download original image
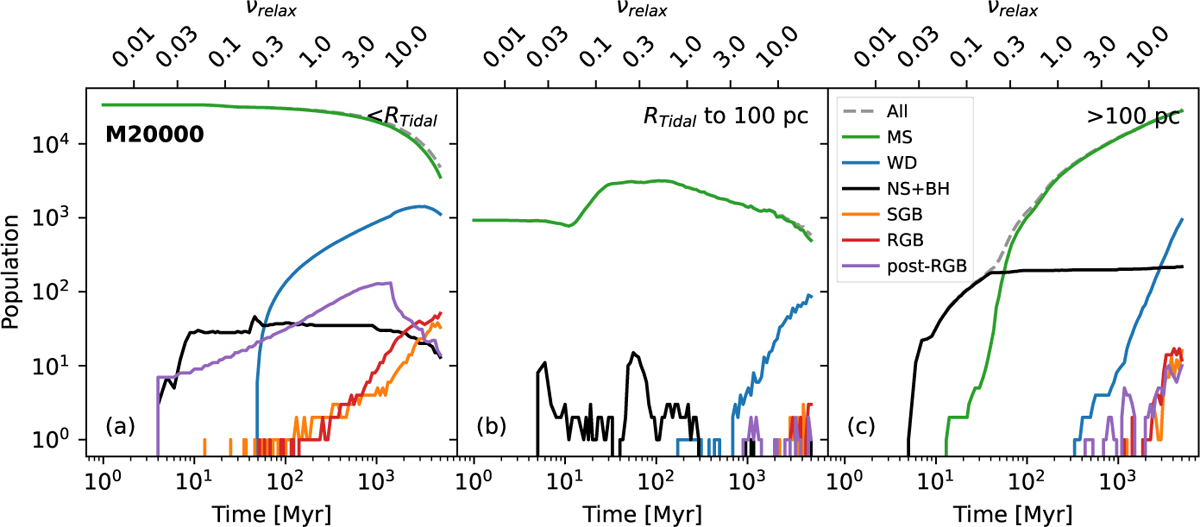
Stellar type population changes in the cluster (a), near-tail (b), and the far-tail (c) for the M20000 model. Population evolution is shown for all stars, the main sequence (MS), white dwarfs (WDs), neutron stars (NSs) + black holes (BHs), subgiant (SGBs), red giant (RGBs), and the post-RGB population. The vrelax is shown for reference. Similar plots for M4641 and M1000 are shown in Figure A.7.
Current usage metrics show cumulative count of Article Views (full-text article views including HTML views, PDF and ePub downloads, according to the available data) and Abstracts Views on Vision4Press platform.
Data correspond to usage on the plateform after 2015. The current usage metrics is available 48-96 hours after online publication and is updated daily on week days.
Initial download of the metrics may take a while.