Fig. 7
Download original image
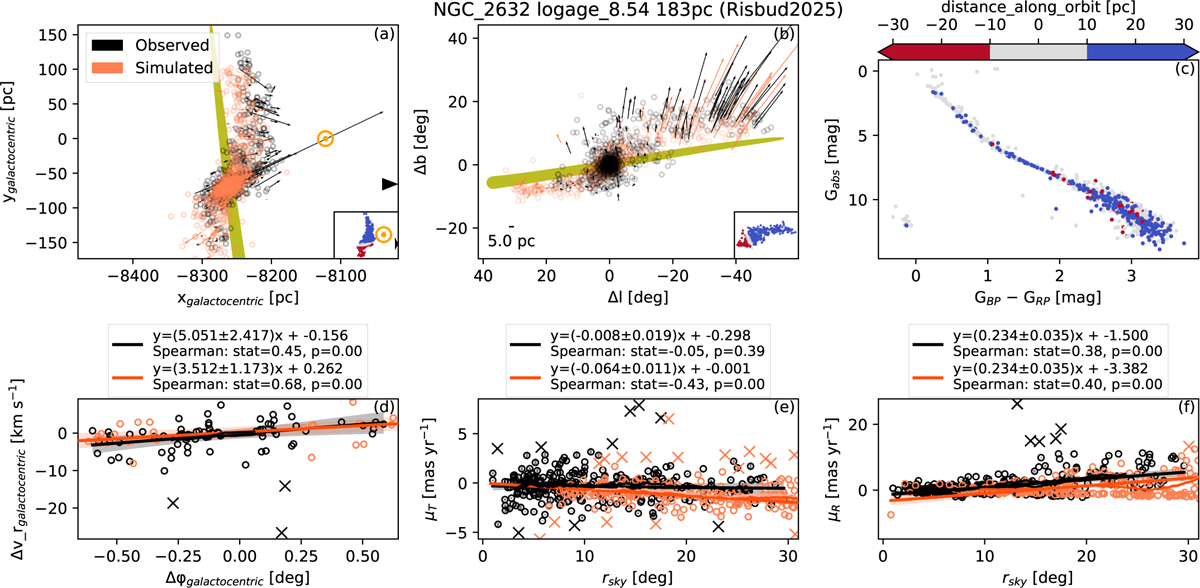
Diagnostic plots for a silver (NGC 2632) cluster. (a) Spatial distribution in the Galactocentric plane. The observed cluster (black) and simulated (with Gaia-like noise) cluster (coral) members are shown with arrows indicating the cluster-centric velocities. The Galactic orbit is shown by the olive arrow. (b) Distribution in tangential Galactic co-ordinates. (c) Absolute CMD coloured according to distance along the orbit. The same colour scheme is used for the small plots in the corners of (a) & (b). (d) Variation in Vr,galactocentric with φgalactocentric. (e) R – μT distribution. (f) R−μR distribution. The central 20 pc region is omitted in (d-f) plots, and the outlier-rejected regression and Spearman correlation test results are given in the legend. The rolling average is plotted as a fainter line in (d-f).
Current usage metrics show cumulative count of Article Views (full-text article views including HTML views, PDF and ePub downloads, according to the available data) and Abstracts Views on Vision4Press platform.
Data correspond to usage on the plateform after 2015. The current usage metrics is available 48-96 hours after online publication and is updated daily on week days.
Initial download of the metrics may take a while.