Fig. 8
Download original image
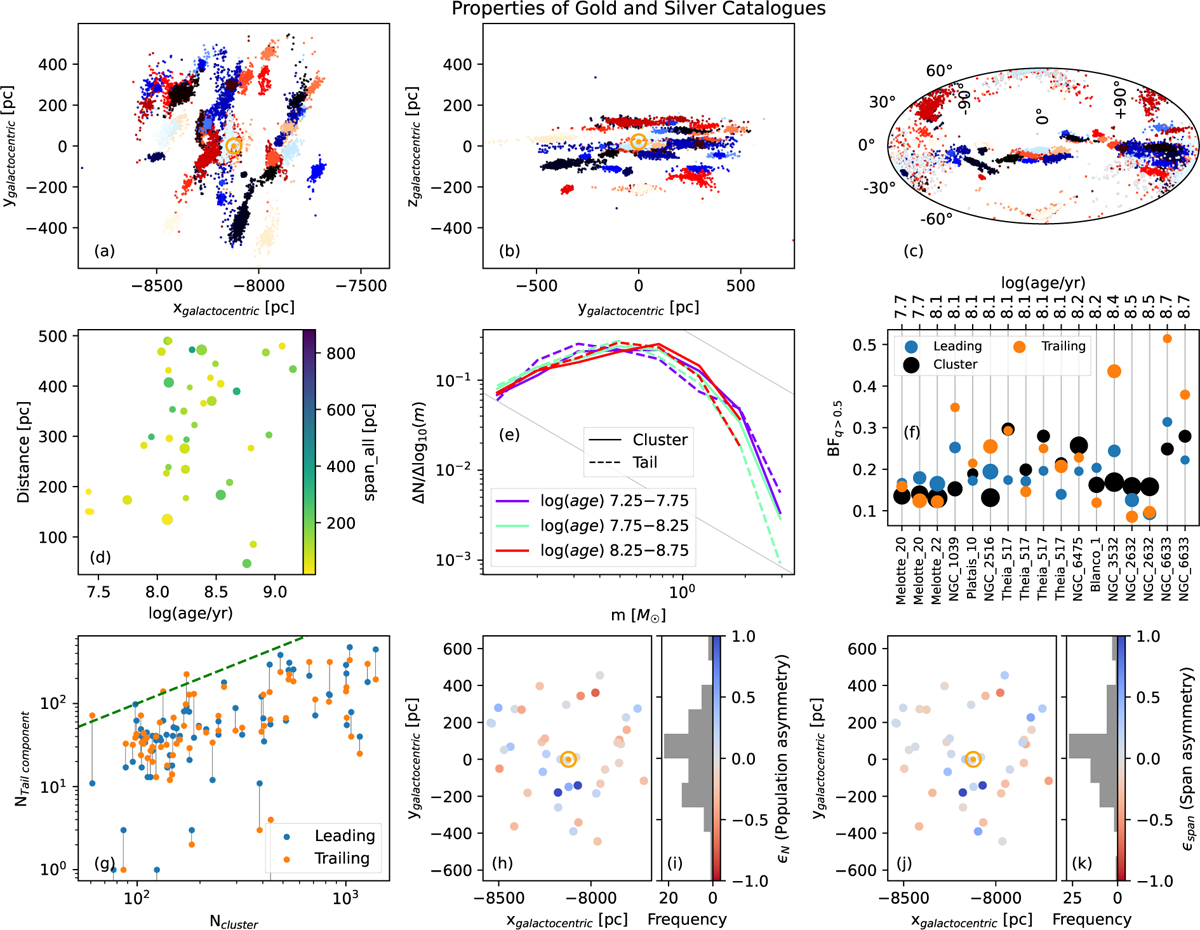
Properties of observed tidal tails in gold and silver catalogues. (a) Spatial distribution of tidal tails and clusters (coloured arbitrarily) in the Galactic X Y plane. (b) Spatial distribution of tidal tails and clusters in the Galactic Y Z plane. (c) Spatial distribution of tidal tails and clusters in the Galactic co-ordinate plane. (d) The distribution of cluster age and distance from the Sun, coloured according to the total span and sized according to Ncluster. (e) MF of all stars in the clusters (solid lines) and tail (dashed lines), binned according to the cluster age. The grey lines indicate Salpeter IMF slope. (f) Variation in BF for the cluster and the tidal tails (ordered according to the cluster age). Only the clusters with <40% errors in all three BFs are shown. The marker size corresponds to the population size. (g) Distribution of the detected tail population with the cluster population. The leading (blue) and trailing (orange) tails are shown connected by a solid grey line. The dashed green line represents Ntail=Ncluster. (h) Clusters coloured according to normalised asymmetry in the tail populations (εN). (i) Histogram of εN. (j) Clusters coloured according to normalised asymmetry in the tail spans (εspan). (k) Histogram of εspan. Similar plots for the bronze catalogues are given in Figure A.9.
Current usage metrics show cumulative count of Article Views (full-text article views including HTML views, PDF and ePub downloads, according to the available data) and Abstracts Views on Vision4Press platform.
Data correspond to usage on the plateform after 2015. The current usage metrics is available 48-96 hours after online publication and is updated daily on week days.
Initial download of the metrics may take a while.