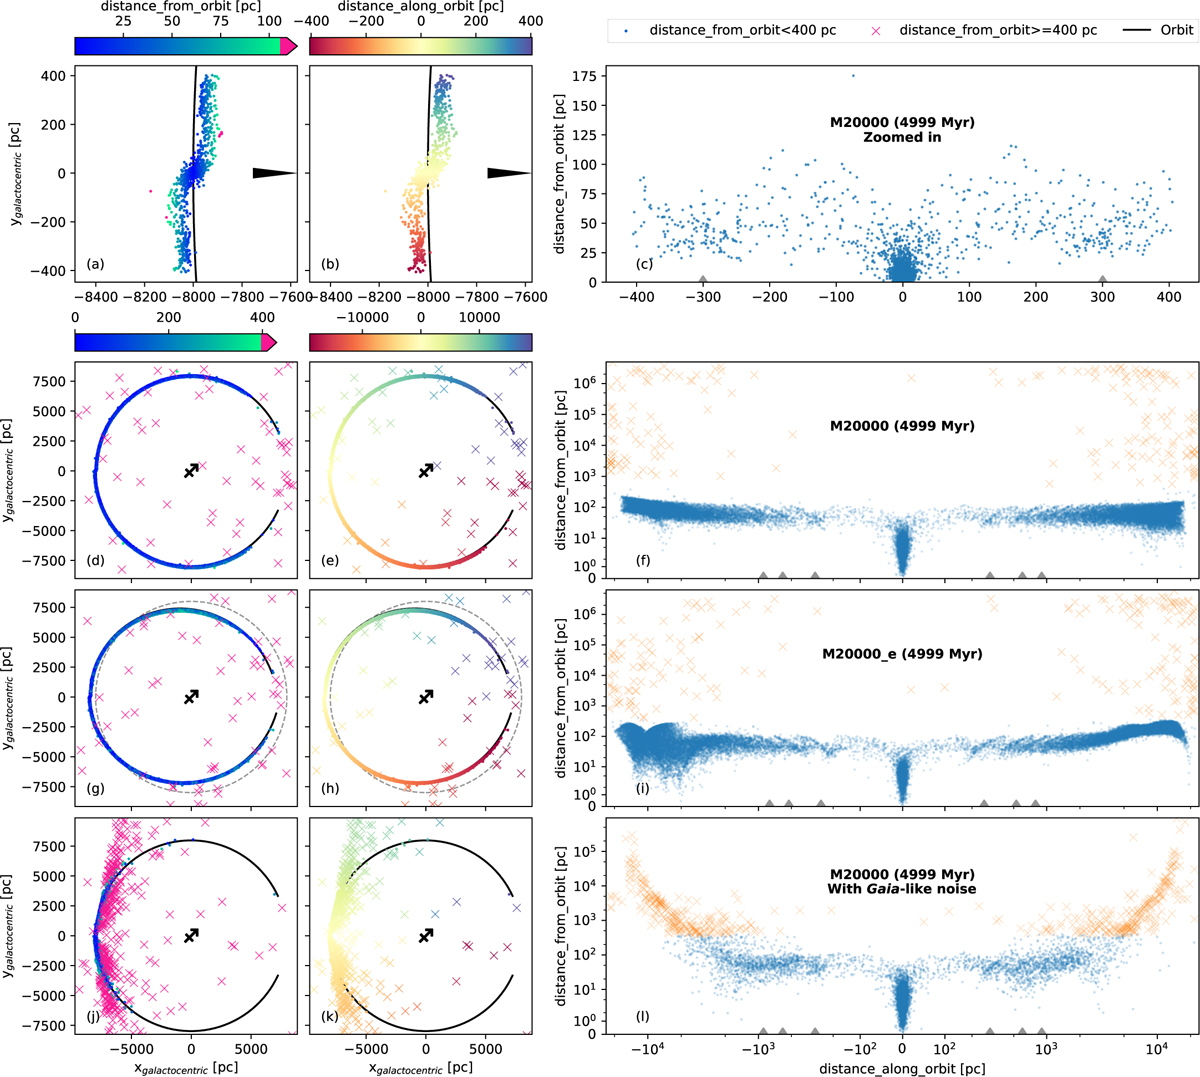
Fig. A.1
Download original image
Demonstration of the distance_from_orbit (panels a, d, g, and j) and distance_along_orbit (panels b, e, h, and k) measurements for M20000 (first, second row), M20000_e (third row), and a noisy-M20000 (fourth row) at 4999 Myr. The stars well outside the average locus (distance_from_orbit ≥ 400 pc) are shown by crosses. First and second columns are coloured according to distance_from_orbit and distance_along_orbit, respectively. The 8 kpc circle is shown by a dashed grey curve in panels (g) and (h) for reference (the orbit itself is a circle of radius 8 kpc for the model M20000). The axes in panels (f), (i) & (l) use Asinh scaling for better visualisation, and the ± 20, ± 40, and ± 60Rtidal are marked by the grey triangles along the x axis.
Current usage metrics show cumulative count of Article Views (full-text article views including HTML views, PDF and ePub downloads, according to the available data) and Abstracts Views on Vision4Press platform.
Data correspond to usage on the plateform after 2015. The current usage metrics is available 48-96 hours after online publication and is updated daily on week days.
Initial download of the metrics may take a while.