Open Access
Fig. 12
Download original image
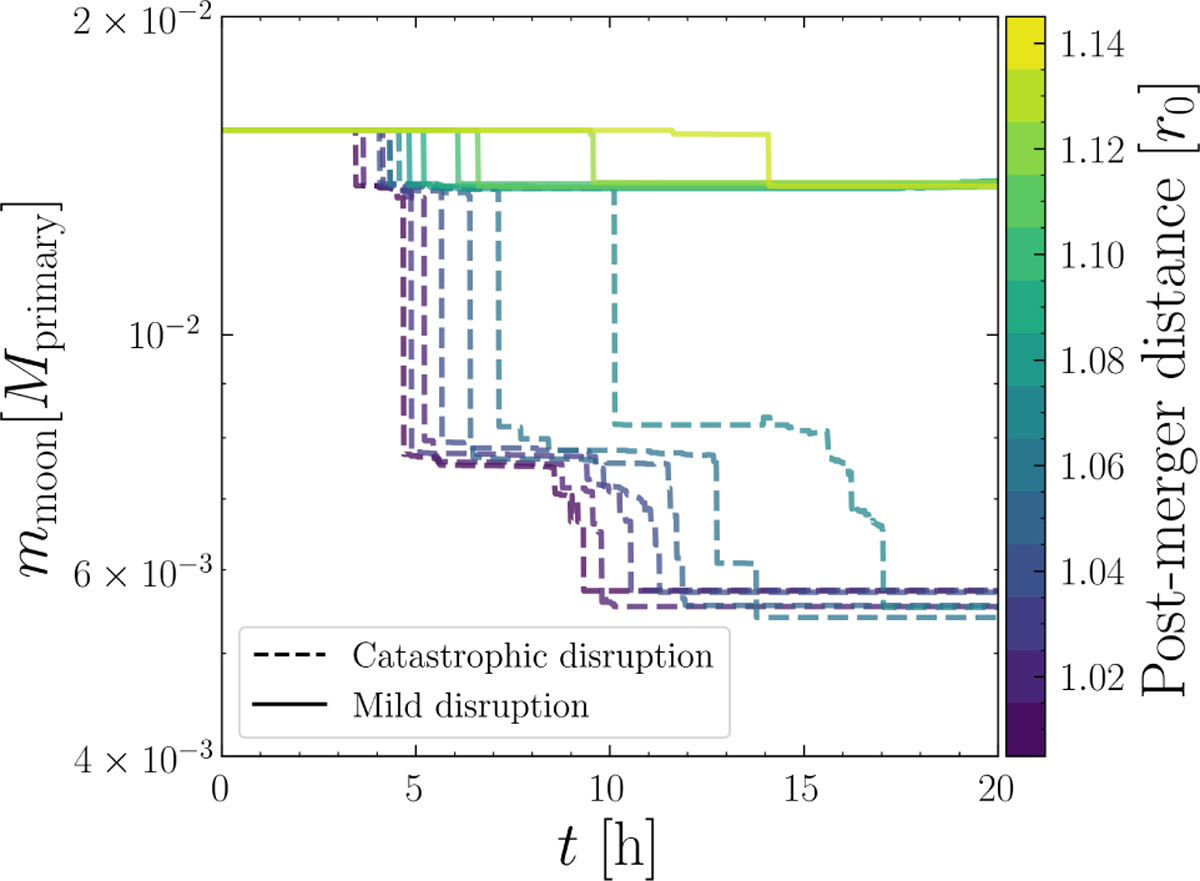
Change in mass over time for the simulation scenarios leading to the shapes in Fig. 9 that undergo tidal disruption. The bodies undergoing catastrophic disruption have dashed lines, while the mild disruption scenarios have solid lines. The colour of each line represents its initial post-merger distance from the primary.
Current usage metrics show cumulative count of Article Views (full-text article views including HTML views, PDF and ePub downloads, according to the available data) and Abstracts Views on Vision4Press platform.
Data correspond to usage on the plateform after 2015. The current usage metrics is available 48-96 hours after online publication and is updated daily on week days.
Initial download of the metrics may take a while.