Fig. 3
Download original image
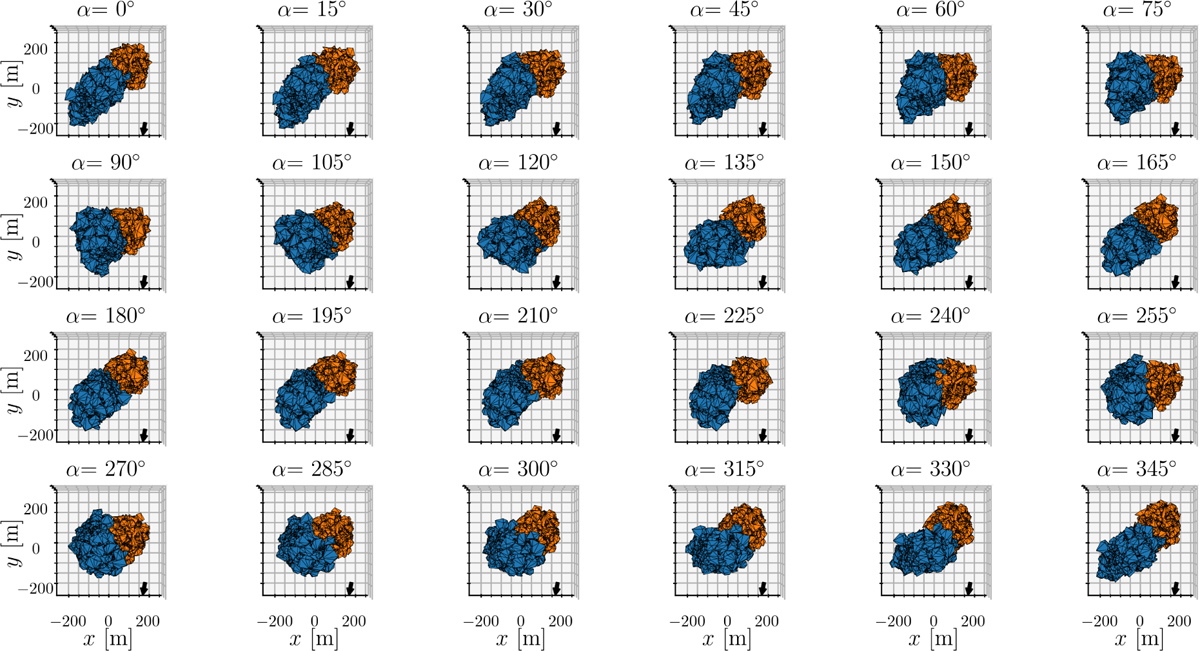
Shapes and orientations of each formed moon after 3 h of simulation time after a sub-escape-velocity merger between the two moonlets in Table 2. The value α, represents the counter-clockwise rotation relative to the initial position of moonlet A in Fig. 1 around its barycentre. The particles originally belonging to moonlet A have been coloured in blue, while the corresponding particles from moonlet B are orange. The black arrow in each plot is pointing in the direction of the primary.
Current usage metrics show cumulative count of Article Views (full-text article views including HTML views, PDF and ePub downloads, according to the available data) and Abstracts Views on Vision4Press platform.
Data correspond to usage on the plateform after 2015. The current usage metrics is available 48-96 hours after online publication and is updated daily on week days.
Initial download of the metrics may take a while.