Open Access
Fig. 9
Download original image
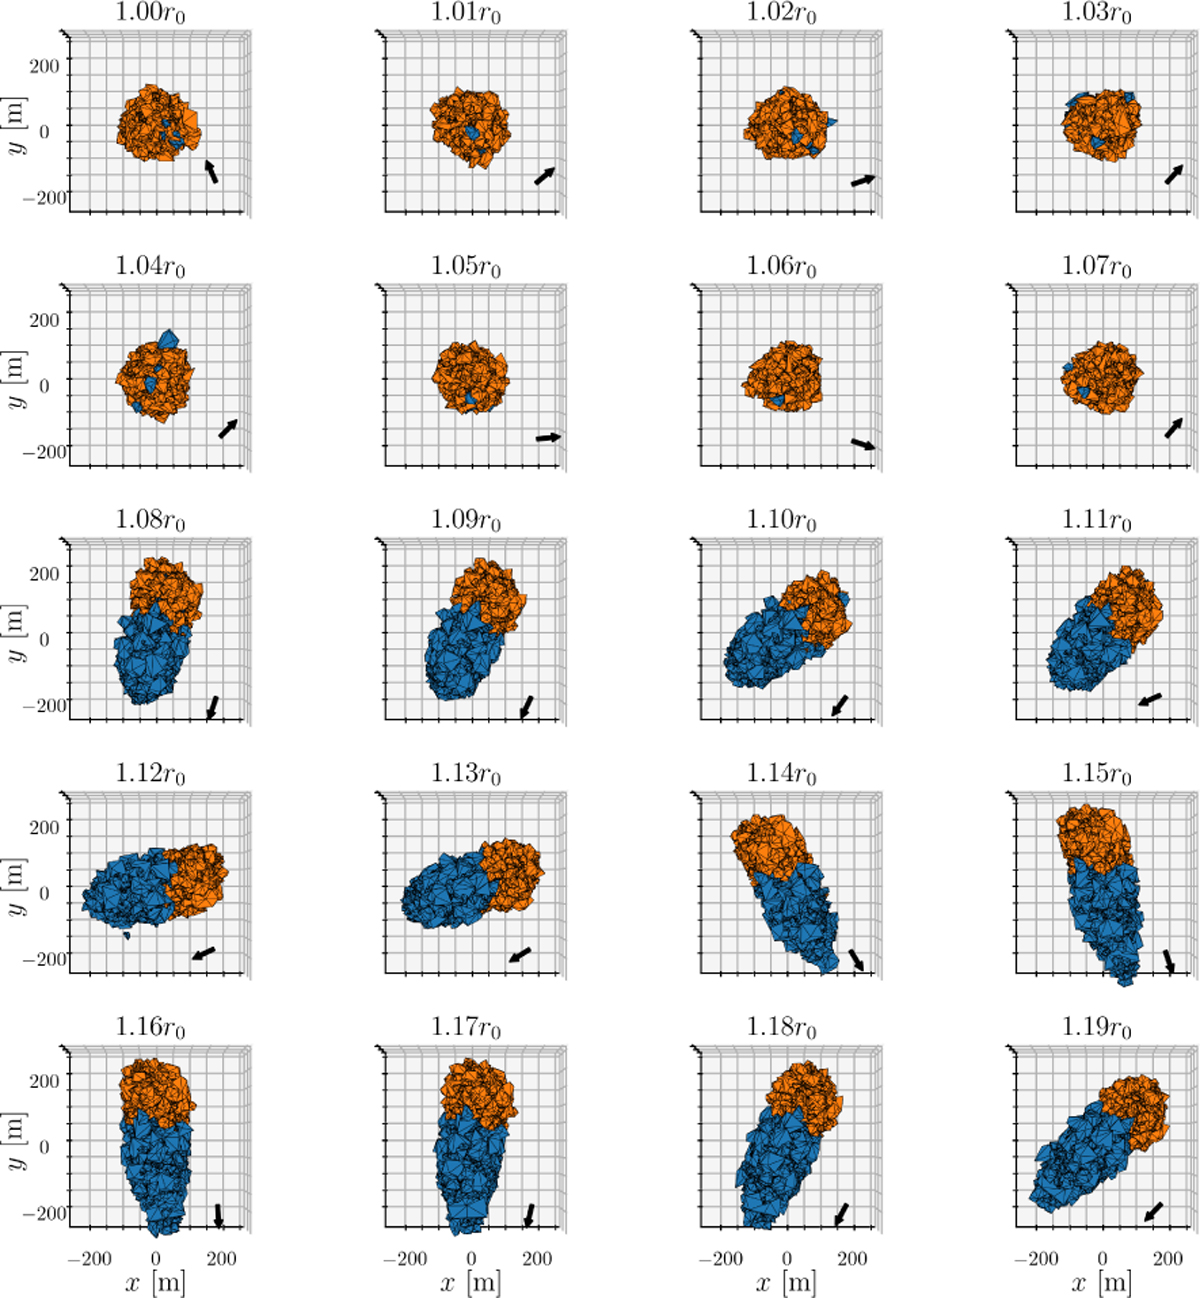
Shapes and orientations of aggregates after 45 h of post-merger evolution, based on the case of α = 0° in Fig. 3. Each case represents a different shift in distance from the primary barycentre after the merger has occurred, between r0 and 1.19r0.
Current usage metrics show cumulative count of Article Views (full-text article views including HTML views, PDF and ePub downloads, according to the available data) and Abstracts Views on Vision4Press platform.
Data correspond to usage on the plateform after 2015. The current usage metrics is available 48-96 hours after online publication and is updated daily on week days.
Initial download of the metrics may take a while.