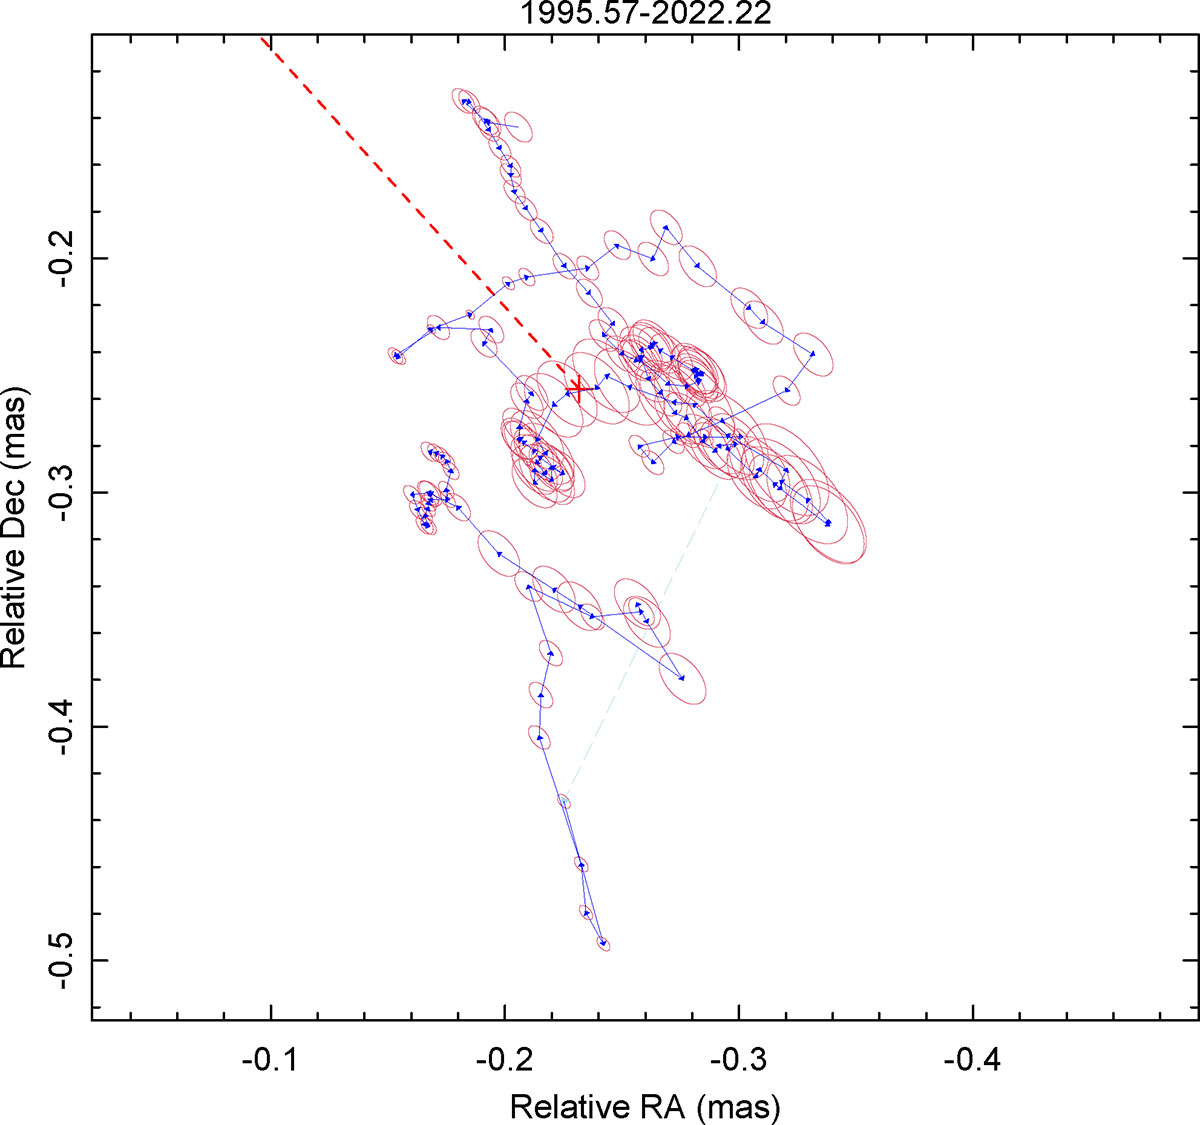
Fig. 11.
Download original image
Trajectory of the QSC from 1995.57 to 2022.22, smoothed using a time window of 1.5 years (blue line). The dashed light blue line connects the endpoints of the observation gap. Red ellipses indicate the average asymmetric positioning uncertainties. The median scatter position is marked with a red plus sign, while the dashed red line represents the central jet axis, connecting the median QSC position to the radio core.
Current usage metrics show cumulative count of Article Views (full-text article views including HTML views, PDF and ePub downloads, according to the available data) and Abstracts Views on Vision4Press platform.
Data correspond to usage on the plateform after 2015. The current usage metrics is available 48-96 hours after online publication and is updated daily on week days.
Initial download of the metrics may take a while.