Fig. 12.
Download original image
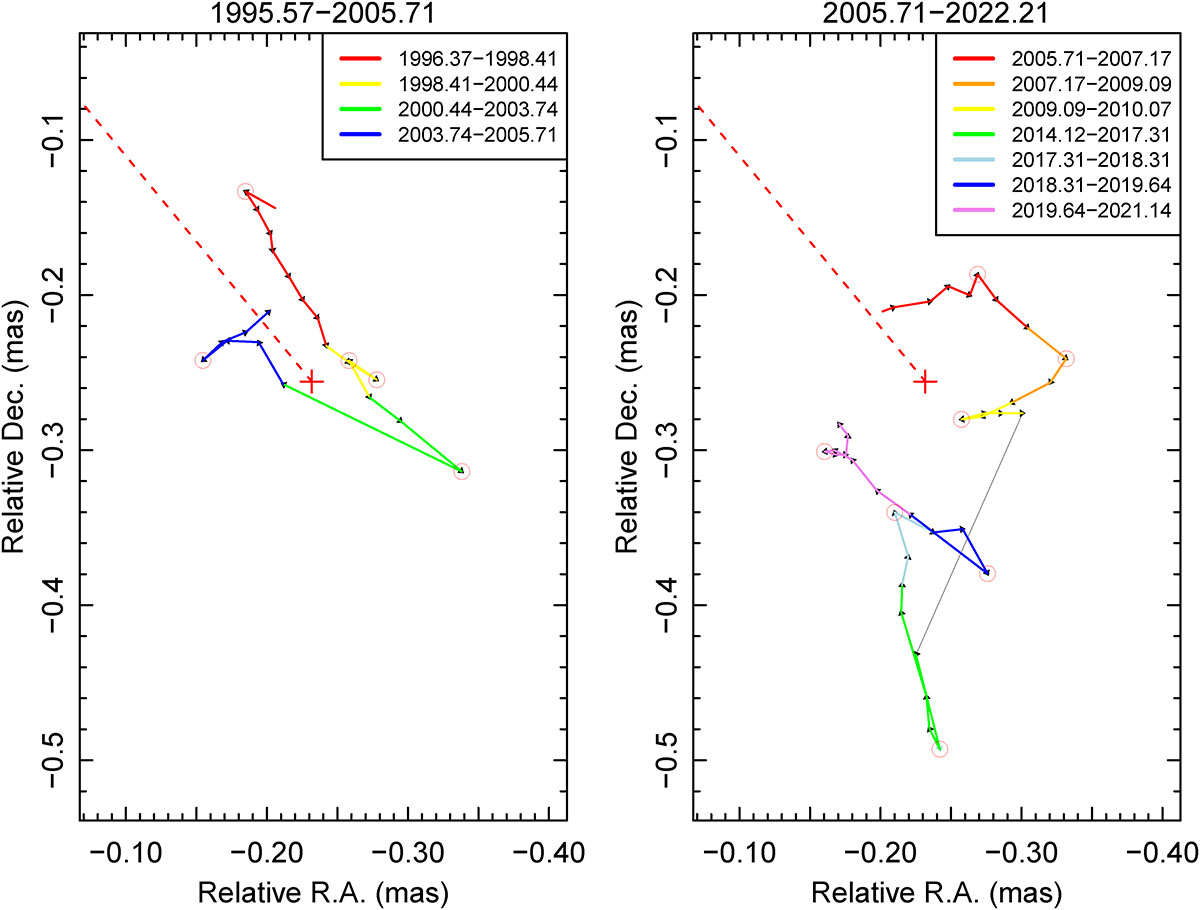
Refined trajectory of the QSC represented for two time periods: 1995.57−2005.71 and 2005.71−2022.22. The arrows denote the direction of movement, and the red circles mark reversal point. The coloured segments of the trajectory represent the path lengths of the identified reversals. In the right panel, the black line connects the endpoints of the observation gap. The median scatter position over the whole time range is marked with a red plus sign, while the dashed red line represents the central jet axis, connecting the median QSC position to the radio core.
Current usage metrics show cumulative count of Article Views (full-text article views including HTML views, PDF and ePub downloads, according to the available data) and Abstracts Views on Vision4Press platform.
Data correspond to usage on the plateform after 2015. The current usage metrics is available 48-96 hours after online publication and is updated daily on week days.
Initial download of the metrics may take a while.