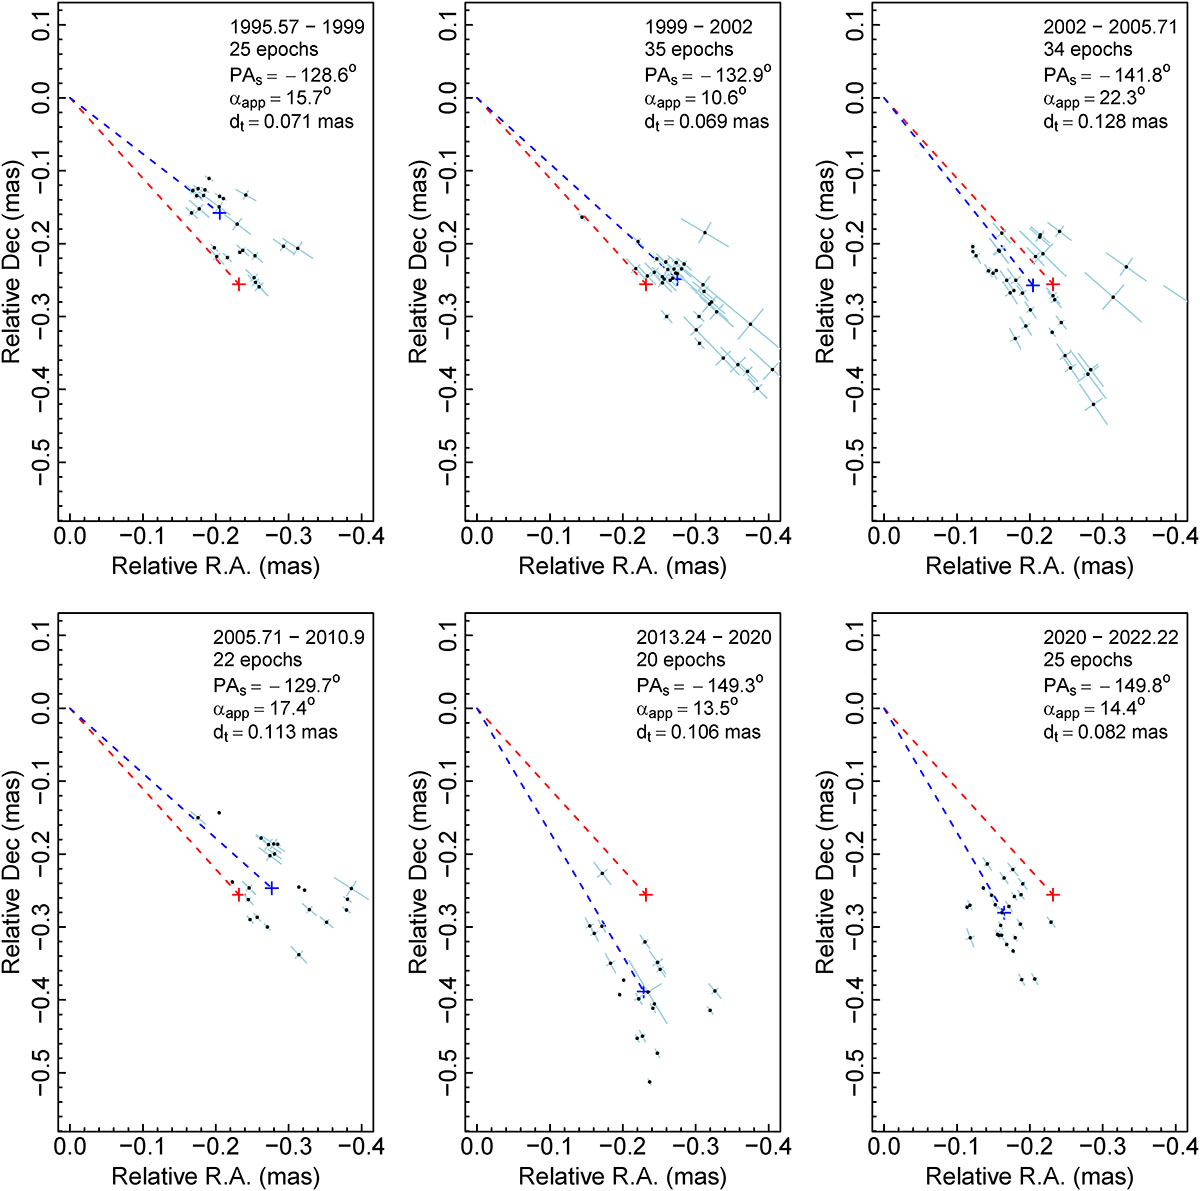
Fig. 3.
Download original image
Positions of the QSC within the six time intervals, 1995.57−1999, 1999−2002, 2002−2005.71, 2005.71−2010.9, 2013.24−2020 and 2020−2022.22. The blue plus sign is the median position of the QSC positions within the given time interval. The dashed blue line is the axis of the jet connecting the core and the median position of QSC. The dashed red line is the central axis of the jet, connecting the median position of QSC over the entire observation period 1995.57−2022.22 and the core. The sizes of the crosses correspond to QSC position errors in the directions toward of and across the core.
Current usage metrics show cumulative count of Article Views (full-text article views including HTML views, PDF and ePub downloads, according to the available data) and Abstracts Views on Vision4Press platform.
Data correspond to usage on the plateform after 2015. The current usage metrics is available 48-96 hours after online publication and is updated daily on week days.
Initial download of the metrics may take a while.