Open Access
Fig. 5.
Download original image
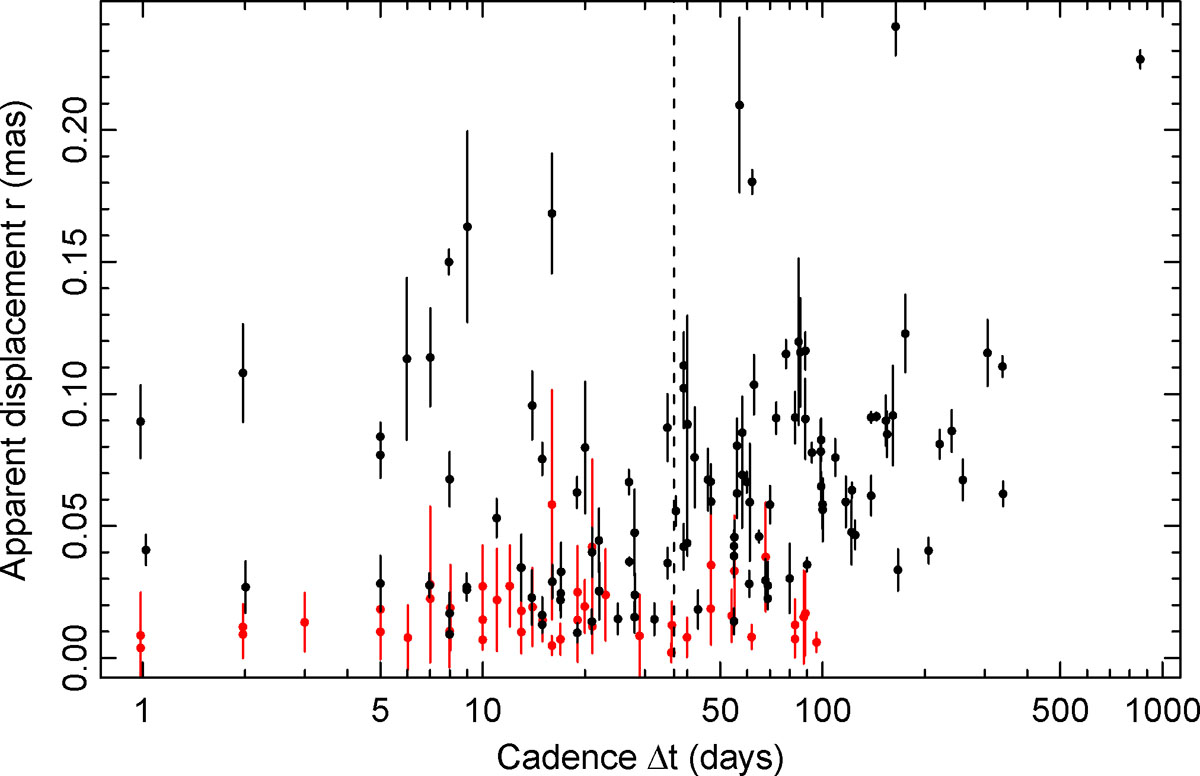
Apparent QSC displacements as a function of the observation time interval. The 1σ uncertainties of the apparent displacements are presented. Apparent displacements with high relative errors εr > 0.5 are indicated in red. The dashed vertical line indicates the median observational interval of 37 days.
Current usage metrics show cumulative count of Article Views (full-text article views including HTML views, PDF and ePub downloads, according to the available data) and Abstracts Views on Vision4Press platform.
Data correspond to usage on the plateform after 2015. The current usage metrics is available 48-96 hours after online publication and is updated daily on week days.
Initial download of the metrics may take a while.