Fig. 3
Download original image
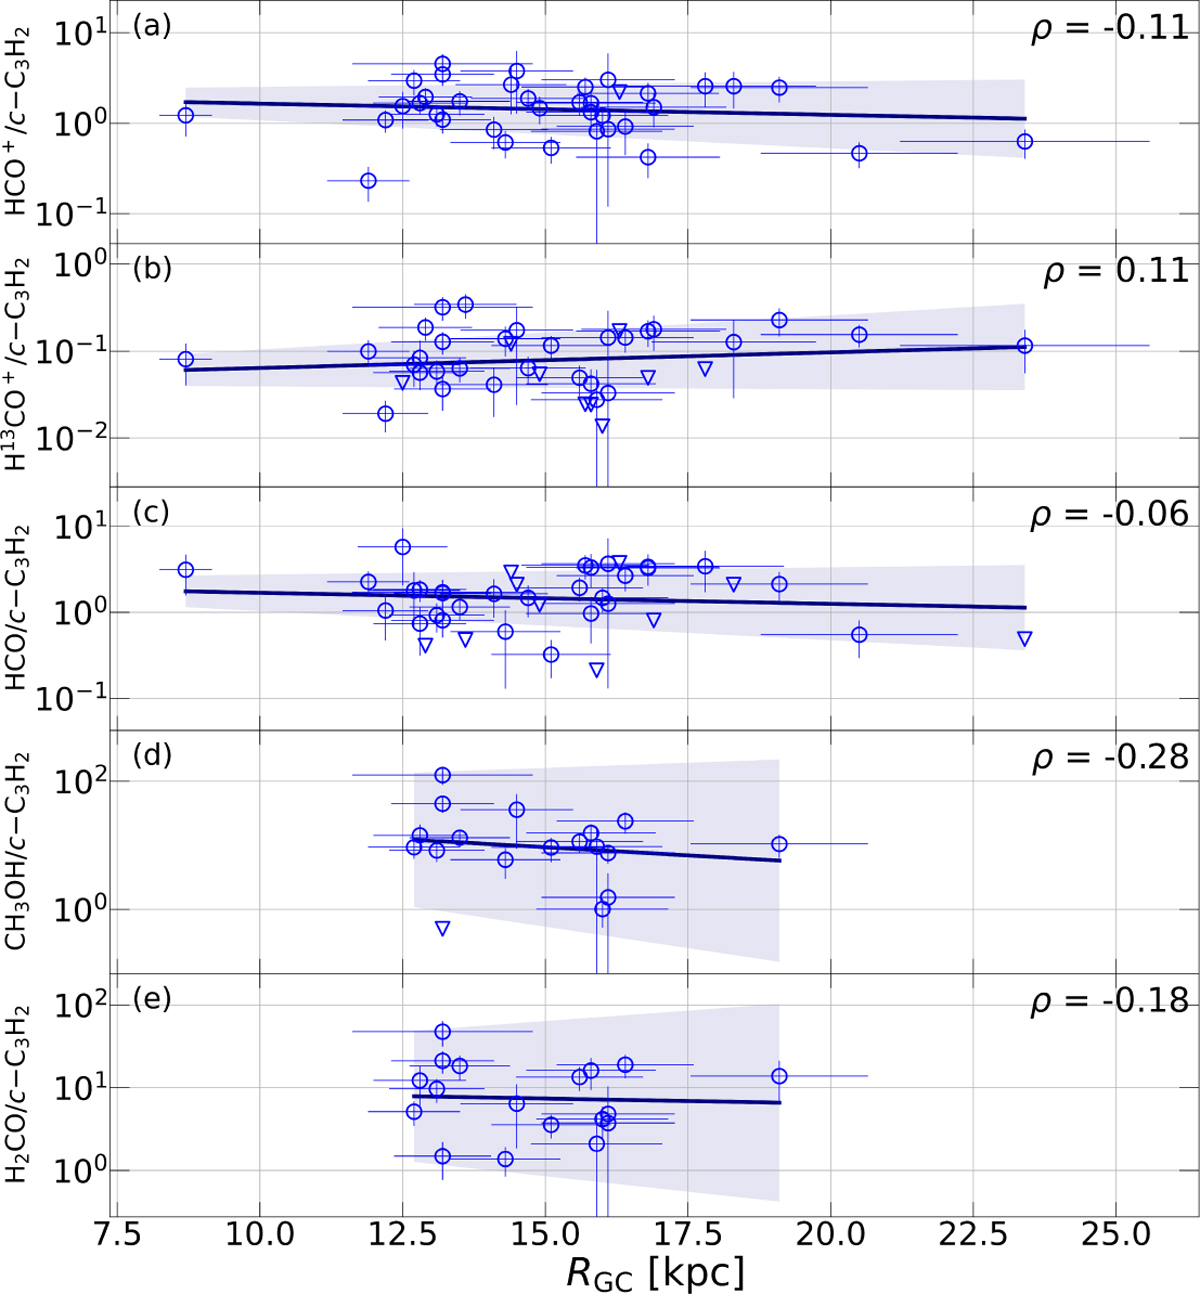
Galactocentric gradients of molecular ratios. The plot shows the trend of the ratios between CO molecule products (i.e., HCO+, H13CO+, HCO, CH3OH, and H2CO) and c-C3H2, as a function of galactocentric radius (RGC). The 1σ error bars over the slope of the gradients are displayed for each molecular fit. The upper limit values are represented with triangles. The linear fit results are shown as the dark blue lines. The 1σ error bars over the slope of the gradients are displayed for each fit. In the upper right side of each subplot, the Pearson correlation coefficient, ρ, is shown.
Current usage metrics show cumulative count of Article Views (full-text article views including HTML views, PDF and ePub downloads, according to the available data) and Abstracts Views on Vision4Press platform.
Data correspond to usage on the plateform after 2015. The current usage metrics is available 48-96 hours after online publication and is updated daily on week days.
Initial download of the metrics may take a while.