Fig. B.4
Download original image
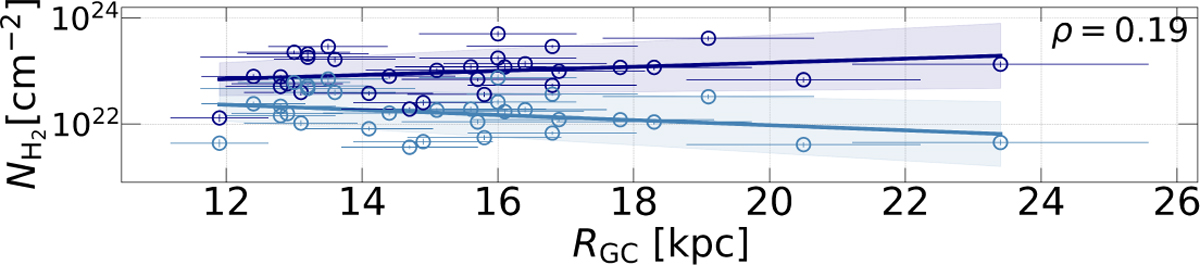
Gradients of column densities of H2, NH2, as a function of Galactocentric radius (RGC). The light blue dataset represents the column densities estimated using a constant gas-to-dust ratio (γ = 100), while the dark blue dataset shows the column densities calculated with a gas-to-dust ratio function of RGC from Giannetti et al. (2017). Both datasets have been fitted with a linear regression. The 1σ error bars over the slope of the gradients are displayed for each fit. In the upper-right side of the plot, the Pearson correlation coefficient, ρ, is shown (only for the dark blue dataset).
Current usage metrics show cumulative count of Article Views (full-text article views including HTML views, PDF and ePub downloads, according to the available data) and Abstracts Views on Vision4Press platform.
Data correspond to usage on the plateform after 2015. The current usage metrics is available 48-96 hours after online publication and is updated daily on week days.
Initial download of the metrics may take a while.