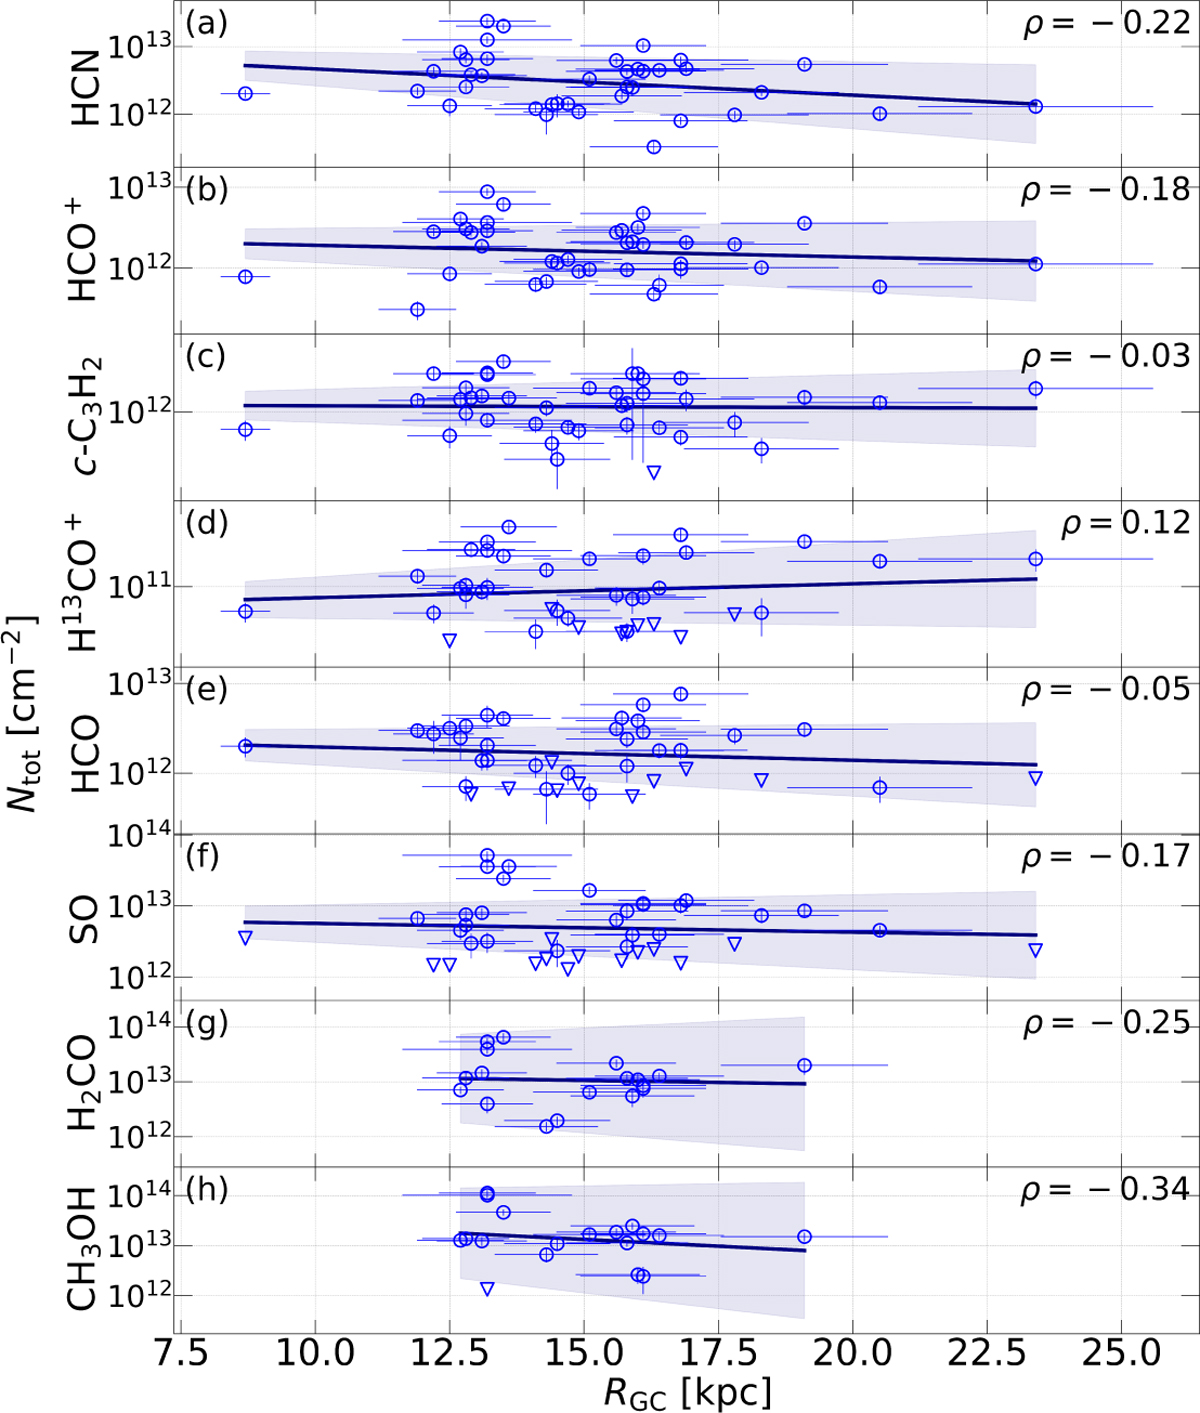
Fig. D.1
Download original image
Galactocentric gradients of column densities, Ntot. The plots show the trends for HCN (a), HCO+ (b), c-C3H2 (c), H13CO+ (d), HCO (e), SO (f), H2CO (g), and CH3OH (h) as a function of Galactocentric radius (RGC). The upper limit values are represented with triangles. The dark blue lines represent the linear regressions computed over the datasets. In the upper-right side of each subplot, the Pearson correlation coefficient, ρ, is shown.
Current usage metrics show cumulative count of Article Views (full-text article views including HTML views, PDF and ePub downloads, according to the available data) and Abstracts Views on Vision4Press platform.
Data correspond to usage on the plateform after 2015. The current usage metrics is available 48-96 hours after online publication and is updated daily on week days.
Initial download of the metrics may take a while.