Fig. E.1
Download original image
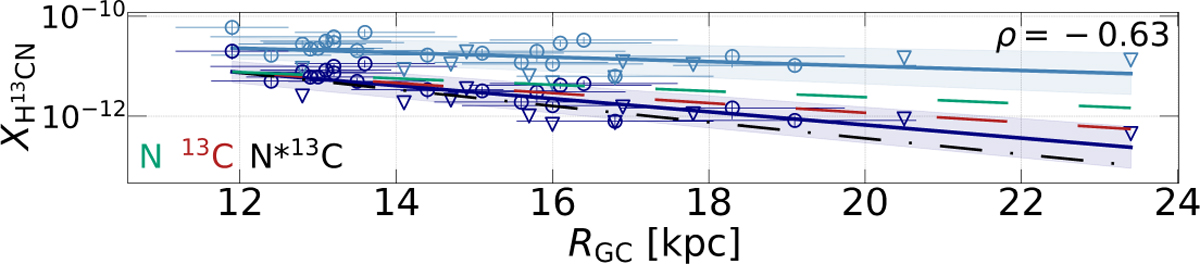
Galactocentric gradients of fractional abundances w.r.t. H2, Xmol, of H13CN. The light blue data represent the abundances calculated using a constant gas-to-dust ratio (γ = 100), while the dark blue data illustrate those estimated using a non-constant gas-to-dust ratio (γ = γ(RGC) from Giannetti et al. 2017). For both datasets, the linear regression results are shown as the light blue and dark blue lines, respectively. The 1σ error bars over the slope of the gradients are displayed for each molecular fit. The upper limit values are represented with triangles. The gradients of the elemental abundances of carbon (13C) and nitrogen (N), as reported by Méndez-Delgado et al. (2022), are plotted as dashed lines. The product of the parent elements of the species is represented by a black dash–dot line. All the elemental trends are plotted shifted to the start of the molecular gradients estimated with γ(RGC) for reference to allow comparison of their slopes with the linear fit of the molecular abundances. In the upper-right side of each plot, the Pearson correlation coefficient, ρ, is shown (estimated only for the abundances estimated using the non-constant gas-to-dust ratio).
Current usage metrics show cumulative count of Article Views (full-text article views including HTML views, PDF and ePub downloads, according to the available data) and Abstracts Views on Vision4Press platform.
Data correspond to usage on the plateform after 2015. The current usage metrics is available 48-96 hours after online publication and is updated daily on week days.
Initial download of the metrics may take a while.