Open Access
Fig. 1.
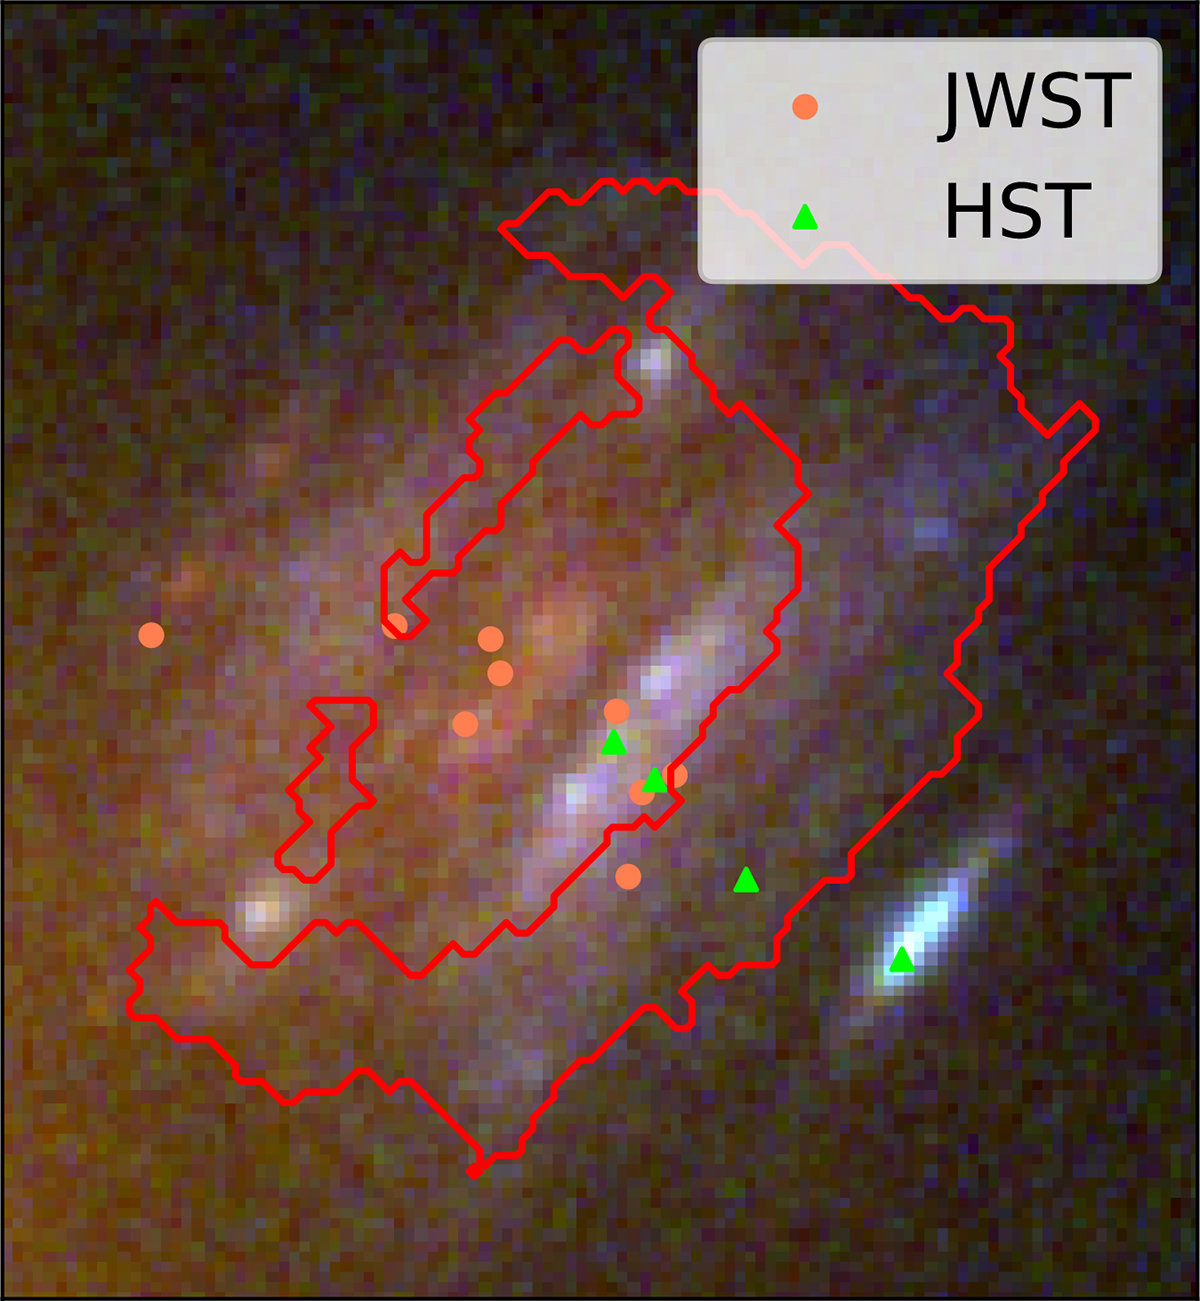
Download original image
RGB image of the Warhol arc (z = 0.94). We show the transients detected in this arc as coral circles (reported by Yan et al. 2023; Williams et al. 2025) and green triangles (reported by Kelly et al. 2022), respectively. We highlight areas characterized as region 2 by Palencia et al. (2025) in red.
Current usage metrics show cumulative count of Article Views (full-text article views including HTML views, PDF and ePub downloads, according to the available data) and Abstracts Views on Vision4Press platform.
Data correspond to usage on the plateform after 2015. The current usage metrics is available 48-96 hours after online publication and is updated daily on week days.
Initial download of the metrics may take a while.