Fig. 5.
Download original image
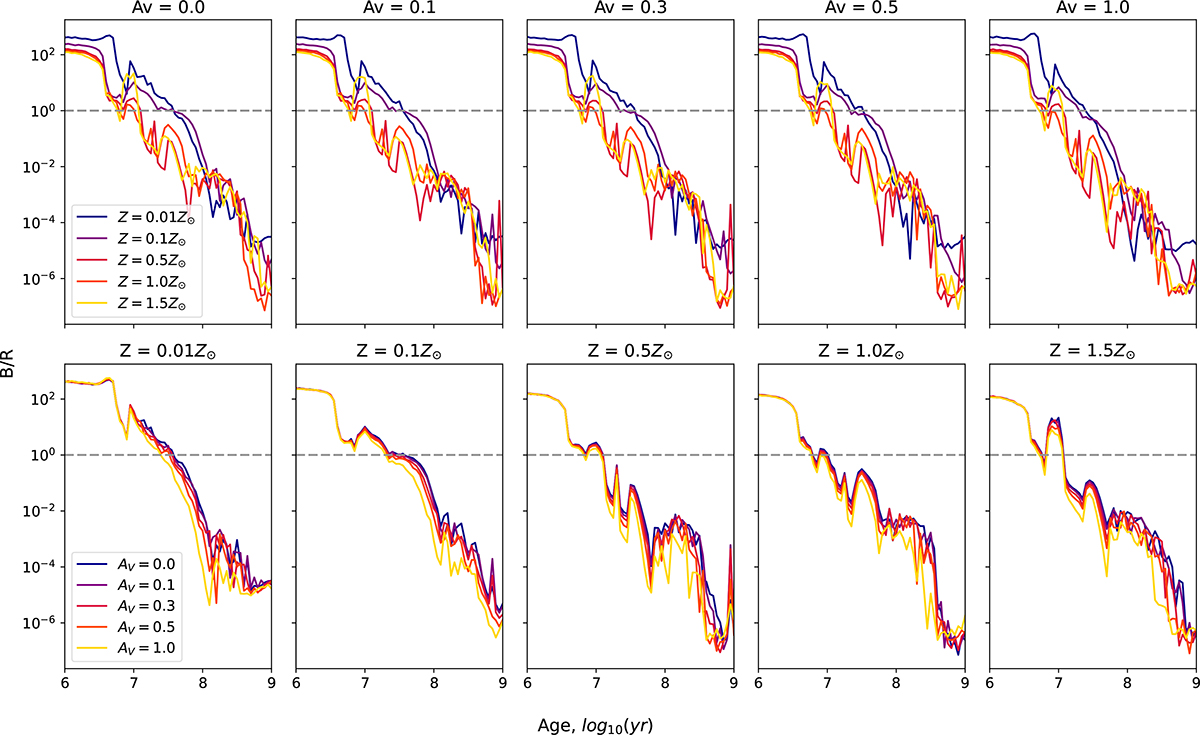
Expected B/R ratio calculated based on the F200LP and F200W transient detection rate in Warhol arc shown in Fig. A.1, with a Kroupa IMF. Each of the panels shows the case for one of the dust extinctions (upper row) or one of the metallicities (lower row), as is indicated by the subtitles. The colour of each curve indicates the metallicities (upper row) or dust extinction (lower row). The dashed gray line denotes B/R = 1 for reference. The fluctuations in ages earlier than ∼50 Myr are significant and arise from intrinsic variation due to stellar evolution, whereas those later than ∼50 Myr arise from sampling uncertainty given the low transient detection rate at these ages. We do not show the error bars for visualization purposes.
Current usage metrics show cumulative count of Article Views (full-text article views including HTML views, PDF and ePub downloads, according to the available data) and Abstracts Views on Vision4Press platform.
Data correspond to usage on the plateform after 2015. The current usage metrics is available 48-96 hours after online publication and is updated daily on week days.
Initial download of the metrics may take a while.