Fig. 7.
Download original image
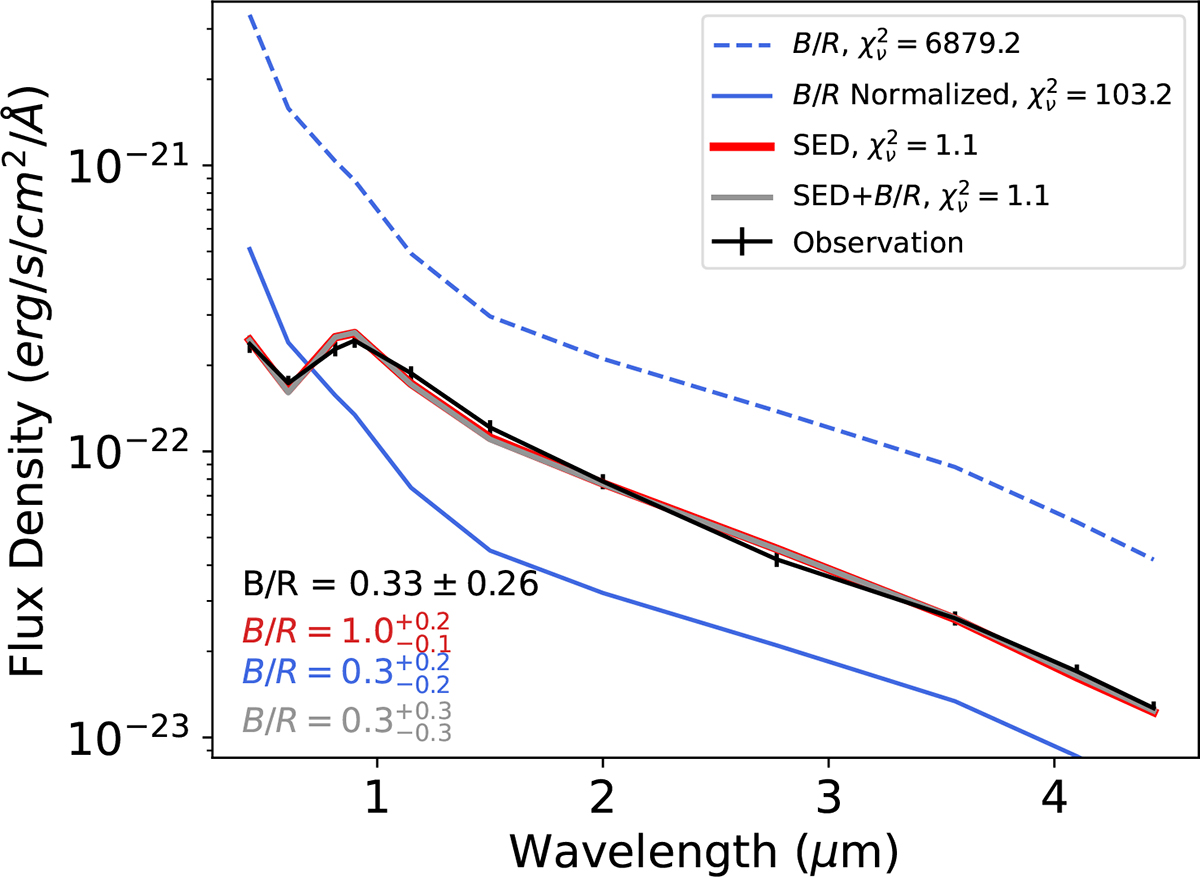
Same as Figure 6, but we use a nonparametric SFH model instead of a single star burst to fit the data. Again, the SFH that is constrained by the SED (red curve) does not predict the B/R ratio well (predicted ![]() , versus observed 0.33 ± 0.26), while that is constrained by the B/R poorly predicts the SED (blue curves). Notice that the B/R ratio is not sensitive to the underlying stellar mass; thus, the SED inferred from B/R deviates significantly from the observed SED (dotted blue curve). We enforced a normalized version of the same SED (solid blue curve), whereby the relative SFR in each age bin of the underlying SFH is invariant, to acquire the best fit to the observed SED. Nevertheless, imposing both the SED and B/R as constraints infers a solution that fits both of the constraints to a sensible degree, which signifies the importance of including the B/R ratio as an extra constraint to better capture the true SFH. The best-fit solution has a metallicity of 0.44 ± 0.21 Z⊙ and a dust extinction of 0.91 ± 0.07, respectively.
, versus observed 0.33 ± 0.26), while that is constrained by the B/R poorly predicts the SED (blue curves). Notice that the B/R ratio is not sensitive to the underlying stellar mass; thus, the SED inferred from B/R deviates significantly from the observed SED (dotted blue curve). We enforced a normalized version of the same SED (solid blue curve), whereby the relative SFR in each age bin of the underlying SFH is invariant, to acquire the best fit to the observed SED. Nevertheless, imposing both the SED and B/R as constraints infers a solution that fits both of the constraints to a sensible degree, which signifies the importance of including the B/R ratio as an extra constraint to better capture the true SFH. The best-fit solution has a metallicity of 0.44 ± 0.21 Z⊙ and a dust extinction of 0.91 ± 0.07, respectively.
Current usage metrics show cumulative count of Article Views (full-text article views including HTML views, PDF and ePub downloads, according to the available data) and Abstracts Views on Vision4Press platform.
Data correspond to usage on the plateform after 2015. The current usage metrics is available 48-96 hours after online publication and is updated daily on week days.
Initial download of the metrics may take a while.