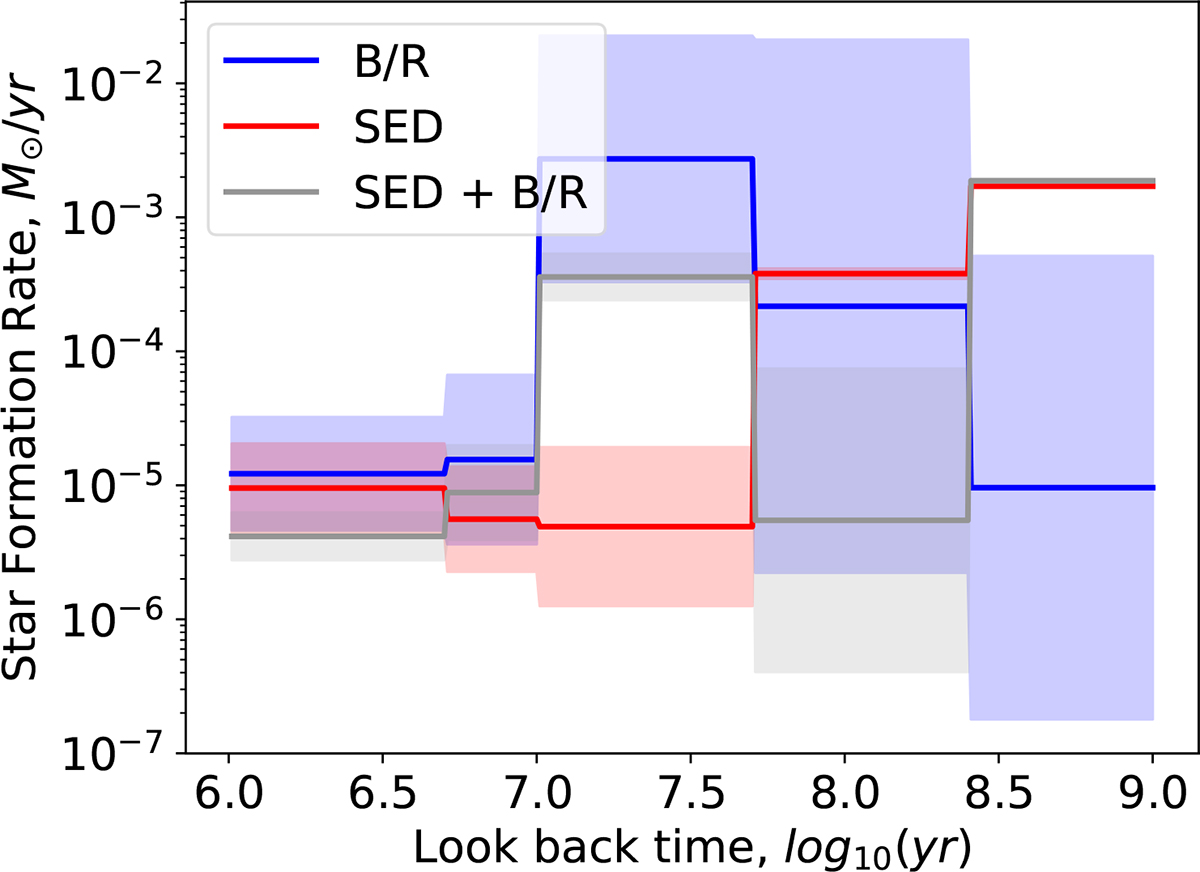
Fig. 8.
Download original image
Corresponding best-fit SFH models of the Warhol arc that generate the SED and B/R ratio shown in Fig. 7 with the band representing the 1σ tolerance from MCMC analysis. One can see that the inclusion of the B/R ratio as a constraint on top of the SED gives rise to a different SFH, with more star formation over the past 10 − 50 Myr (factor of ∼60 with ≳3σ significance) and less star formation over the last 50 − 250 Myr (factor of ∼60 with 2σ).
Current usage metrics show cumulative count of Article Views (full-text article views including HTML views, PDF and ePub downloads, according to the available data) and Abstracts Views on Vision4Press platform.
Data correspond to usage on the plateform after 2015. The current usage metrics is available 48-96 hours after online publication and is updated daily on week days.
Initial download of the metrics may take a while.