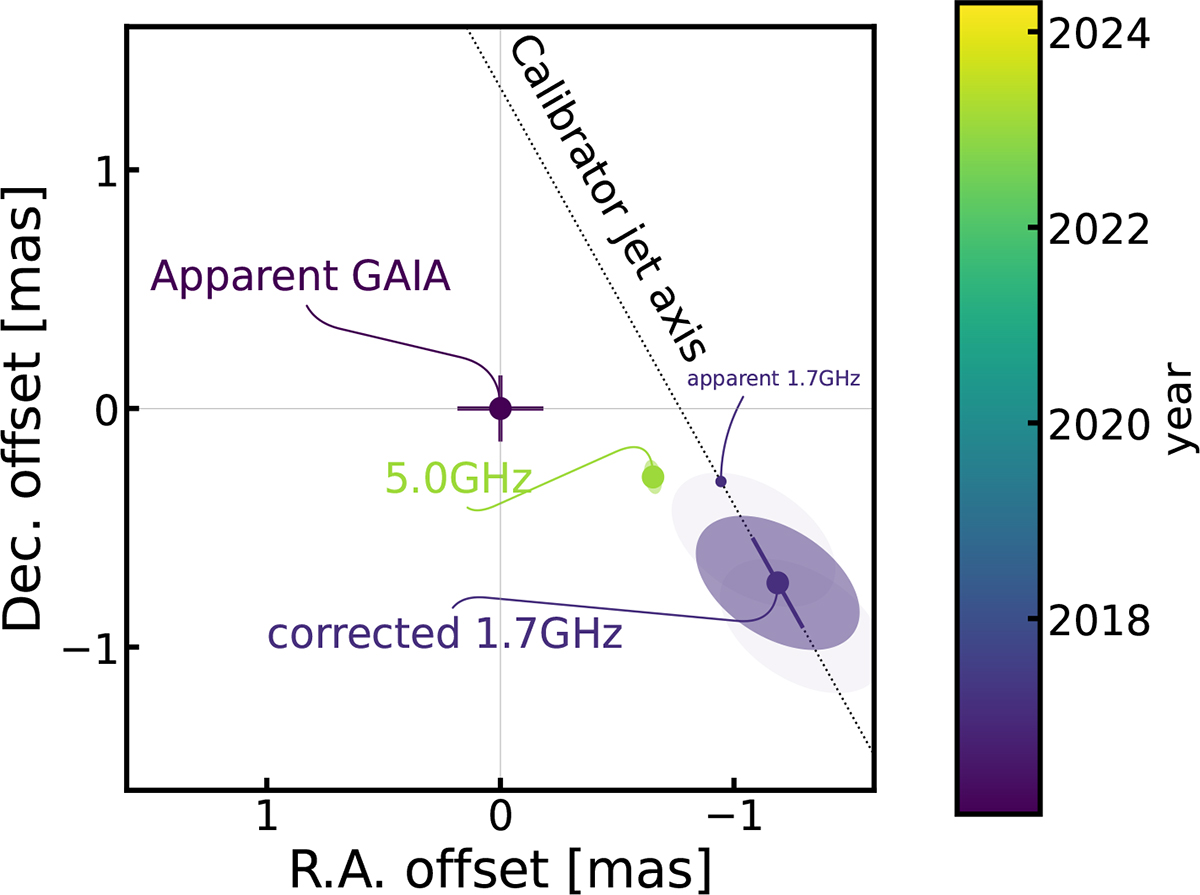
Fig. 3.
Download original image
Astrometry of Gaia, and the 1.7 GHz and 5.0 GHz observations, as annotated. The Gaia optical position is placed at (0,0); all other positions are plotted relative to this position. The ellipses indicates the best fit Gaussian ellipse derived from a model fit to the VLBI data. Uncertainties are at 1σ level. The dashed line indicates the calibrator core shift axis along the apparent 1.7 GHz position (violet dot) is shifted; the translucent gray ellipses indicate the systematic uncertainty of that core shift (see text for details).
Current usage metrics show cumulative count of Article Views (full-text article views including HTML views, PDF and ePub downloads, according to the available data) and Abstracts Views on Vision4Press platform.
Data correspond to usage on the plateform after 2015. The current usage metrics is available 48-96 hours after online publication and is updated daily on week days.
Initial download of the metrics may take a while.