Open Access
Fig. B.4.
Download original image
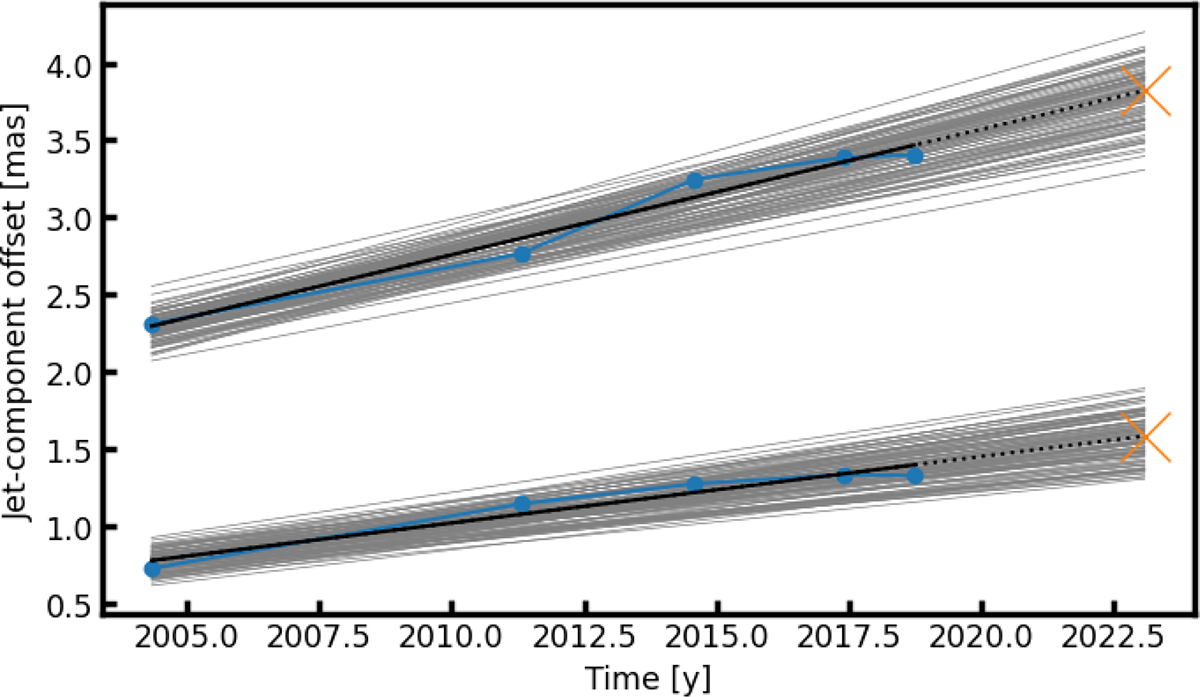
Core to jet-knot separation of the calibrator J1300+2830 as a function of time. The blue points show the R.A. and Dec offset, respectively: the upper one shows R.A., the lower one shows Dec. The gray lines indicate posterior samples of the linear fit.
Current usage metrics show cumulative count of Article Views (full-text article views including HTML views, PDF and ePub downloads, according to the available data) and Abstracts Views on Vision4Press platform.
Data correspond to usage on the plateform after 2015. The current usage metrics is available 48-96 hours after online publication and is updated daily on week days.
Initial download of the metrics may take a while.