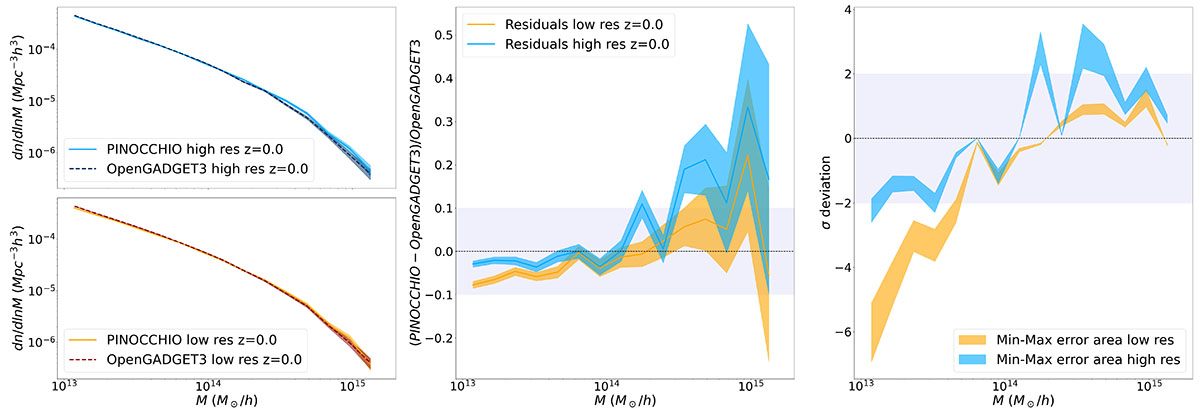
Fig. 1.
Download original image
Comparison of the HMFs (left panel) at z = 0.0 for low- and high-resolution simulations. Jackknife errors are shown as filled regions. In the middle panel, the shaded band indicates a ±10% range around the OpenGADGET3 result, offering a reference for the level of agreement with PINOCCHIO. The filled regions indicates the Jackknife errors around the residual curves. The right panel displays the relative difference between the two HMFs, normalized by the maximum and minimum statistical uncertainties, as described in Eqs. (13) and (12), and expressed in units of σ. The shaded region indicates the ±2σ range, highlighting the level of statistical consistency between the two HMFs. The filled region further illustrates the variation range between these two error estimates.
Current usage metrics show cumulative count of Article Views (full-text article views including HTML views, PDF and ePub downloads, according to the available data) and Abstracts Views on Vision4Press platform.
Data correspond to usage on the plateform after 2015. The current usage metrics is available 48-96 hours after online publication and is updated daily on week days.
Initial download of the metrics may take a while.