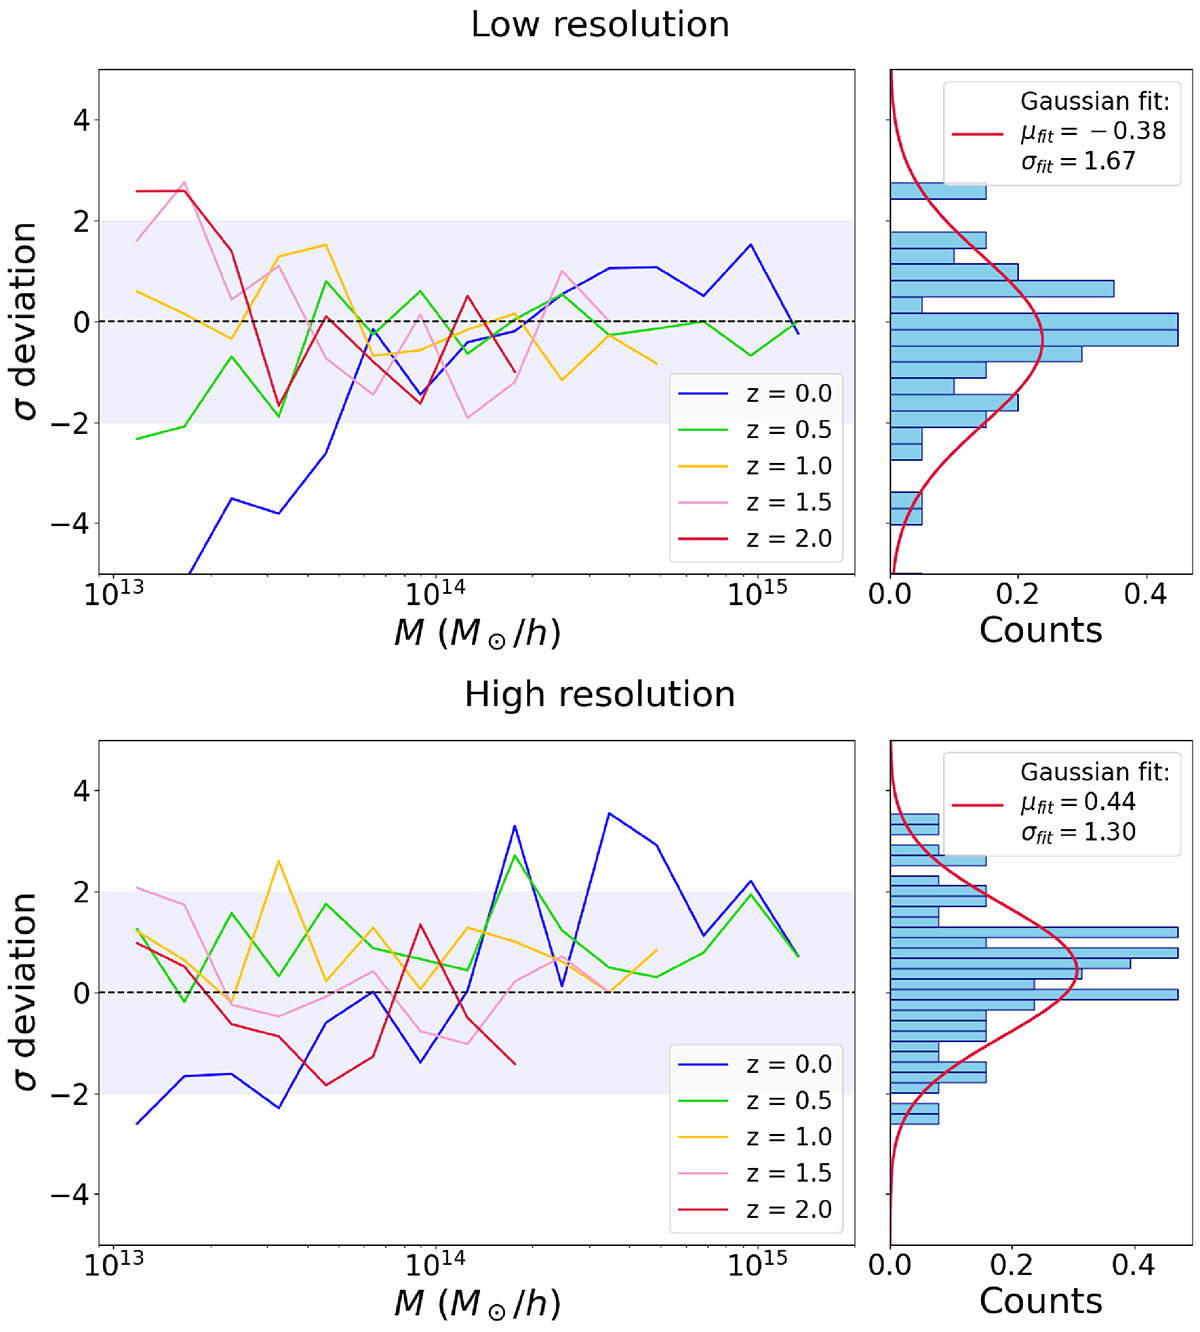
Fig. 2.
Download original image
Left panels: relative difference between the two HMFs at different redshifts z = (0.0, 0.5, 1.0, 1.5, 2.0), with low-resolution results shown on the top and high-resolution results on the bottom. Each line represents the difference between PINOCCHIO and OpenGADGET3, normalized by the Jackknife errors from the OpenGADGET3 estimates as defined in Eq. (12). The shaded area indicates the ±2σ range, highlighting the region of statistical agreement between the two methods. The horizontal dashed line at σ = 0 serves as a reference for perfect agreement. Right panels: overall distribution of the measurements in the left panels, aggregated over all redshifts and size bins, with overlaid Gaussian fits.
Current usage metrics show cumulative count of Article Views (full-text article views including HTML views, PDF and ePub downloads, according to the available data) and Abstracts Views on Vision4Press platform.
Data correspond to usage on the plateform after 2015. The current usage metrics is available 48-96 hours after online publication and is updated daily on week days.
Initial download of the metrics may take a while.