Open Access
Fig. 9.
Download original image
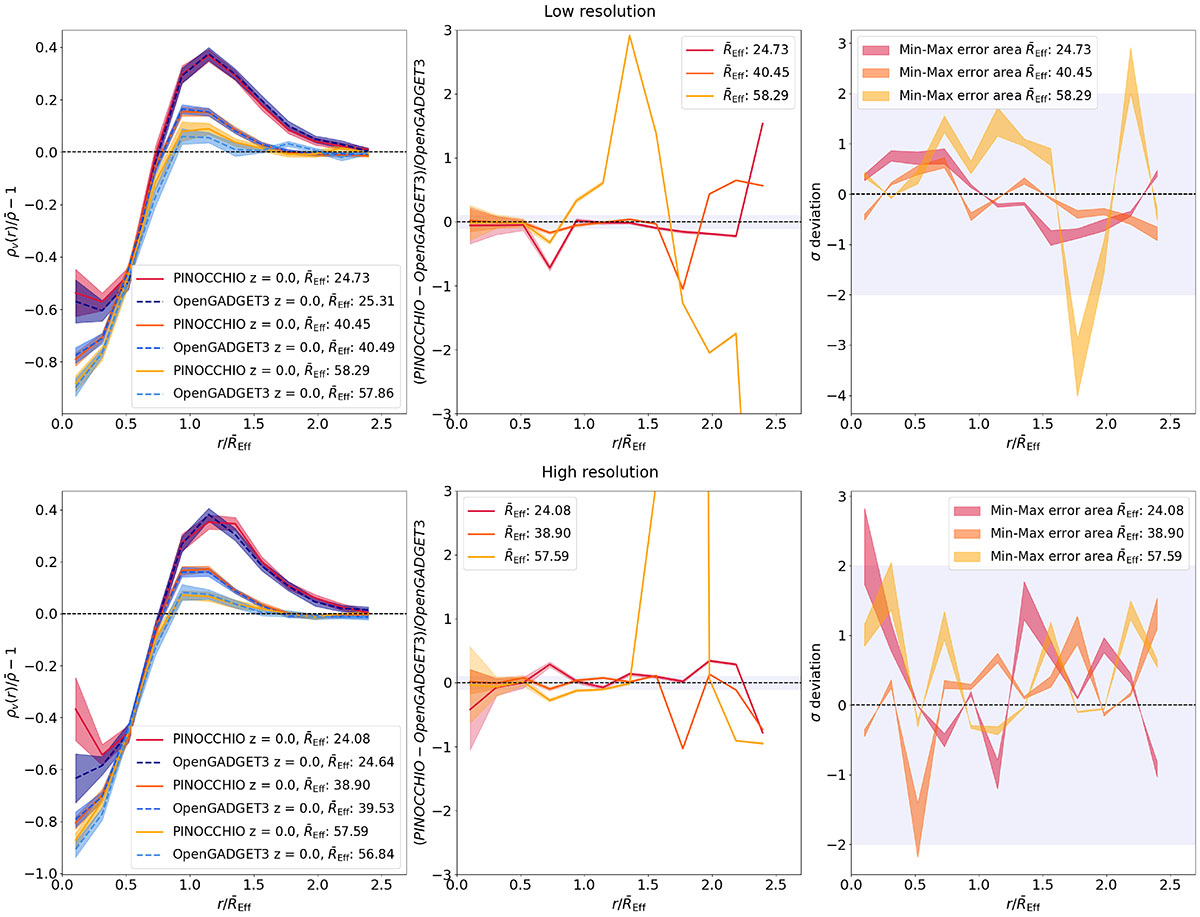
Same as Figure 1, but for the RDPs. The left panels show the stacked radial density profiles, with the legend indicating the mean Reff in each of the three linear bins used for stacking. For clarity, only the mean ![]() from the PINOCCHIO are reported in the middle and right panels.
from the PINOCCHIO are reported in the middle and right panels.
Current usage metrics show cumulative count of Article Views (full-text article views including HTML views, PDF and ePub downloads, according to the available data) and Abstracts Views on Vision4Press platform.
Data correspond to usage on the plateform after 2015. The current usage metrics is available 48-96 hours after online publication and is updated daily on week days.
Initial download of the metrics may take a while.