Fig. 2.
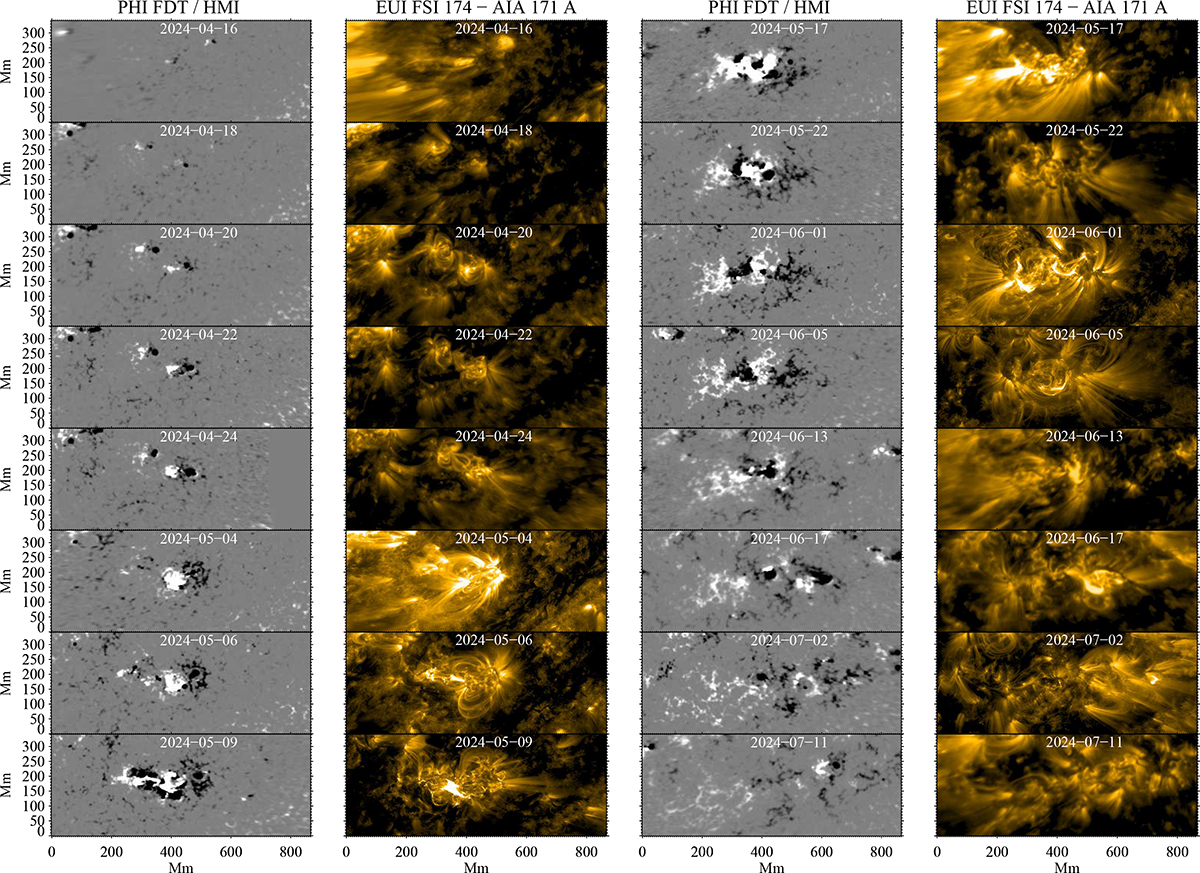
Download original image
Snapshots of the evolution of NOAA 13664/13697/13723 from 16 April 2024. Columns 1 and 3 show the HG-projected maps of BLOS, while columns 2 and 4 show the corresponding maps of EUV emission at the 171−174 Å range. The magnetic field values have been scaled between ±300 G. An animated version of the magnetic field evolution is available online.
Current usage metrics show cumulative count of Article Views (full-text article views including HTML views, PDF and ePub downloads, according to the available data) and Abstracts Views on Vision4Press platform.
Data correspond to usage on the plateform after 2015. The current usage metrics is available 48-96 hours after online publication and is updated daily on week days.
Initial download of the metrics may take a while.