Fig. 5.
Download original image
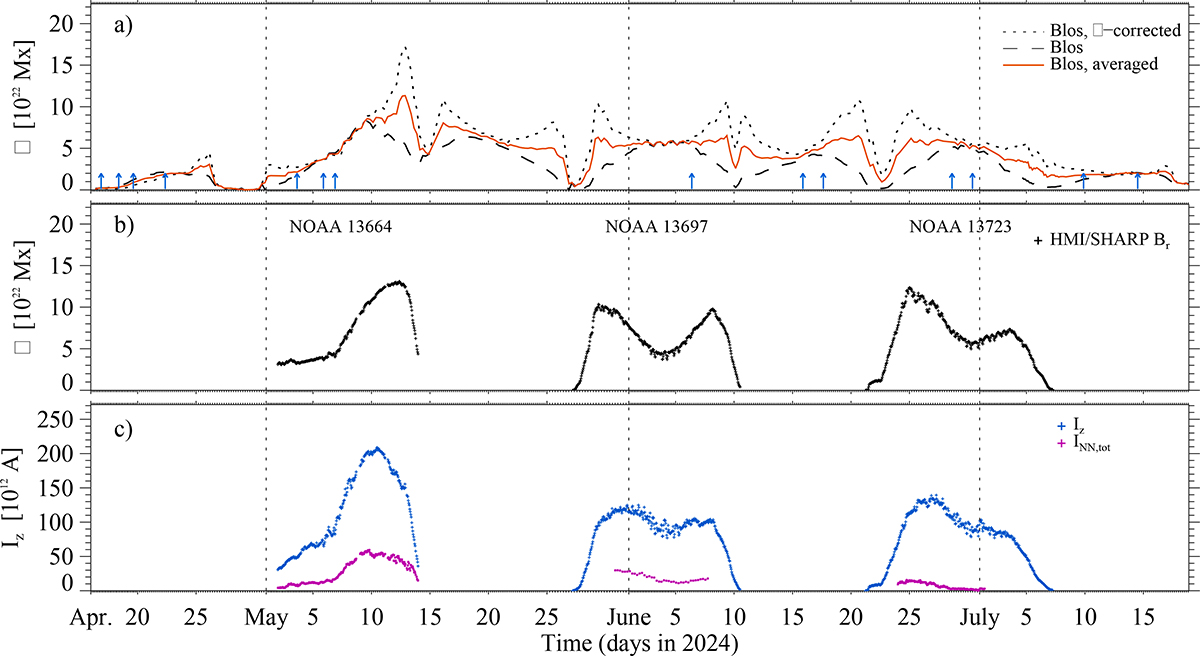
(a) Total unsigned magnetic flux calculated from the collated dataset, for both μ-angle-corrected and uncorrected LOS magnetograms (dotted and dashed lines, respectively). The red line represents the average between the two curves. The blue arrows indicate the onset times of flux emergence events, also shown in Fig. 3. (b) Total unsigned magnetic flux provided from the SHARP and calculated using the radial component, Br, of the magnetic field. (c) Total unsigned vertical electric current provided from the SHARP (blue crosses) and the total unsigned non-neutralized electric current calculated for the same data (magenta crosses). Vertical dashed lines mark the first day of each month, to facilitate comparison.
Current usage metrics show cumulative count of Article Views (full-text article views including HTML views, PDF and ePub downloads, according to the available data) and Abstracts Views on Vision4Press platform.
Data correspond to usage on the plateform after 2015. The current usage metrics is available 48-96 hours after online publication and is updated daily on week days.
Initial download of the metrics may take a while.