Fig. 6.
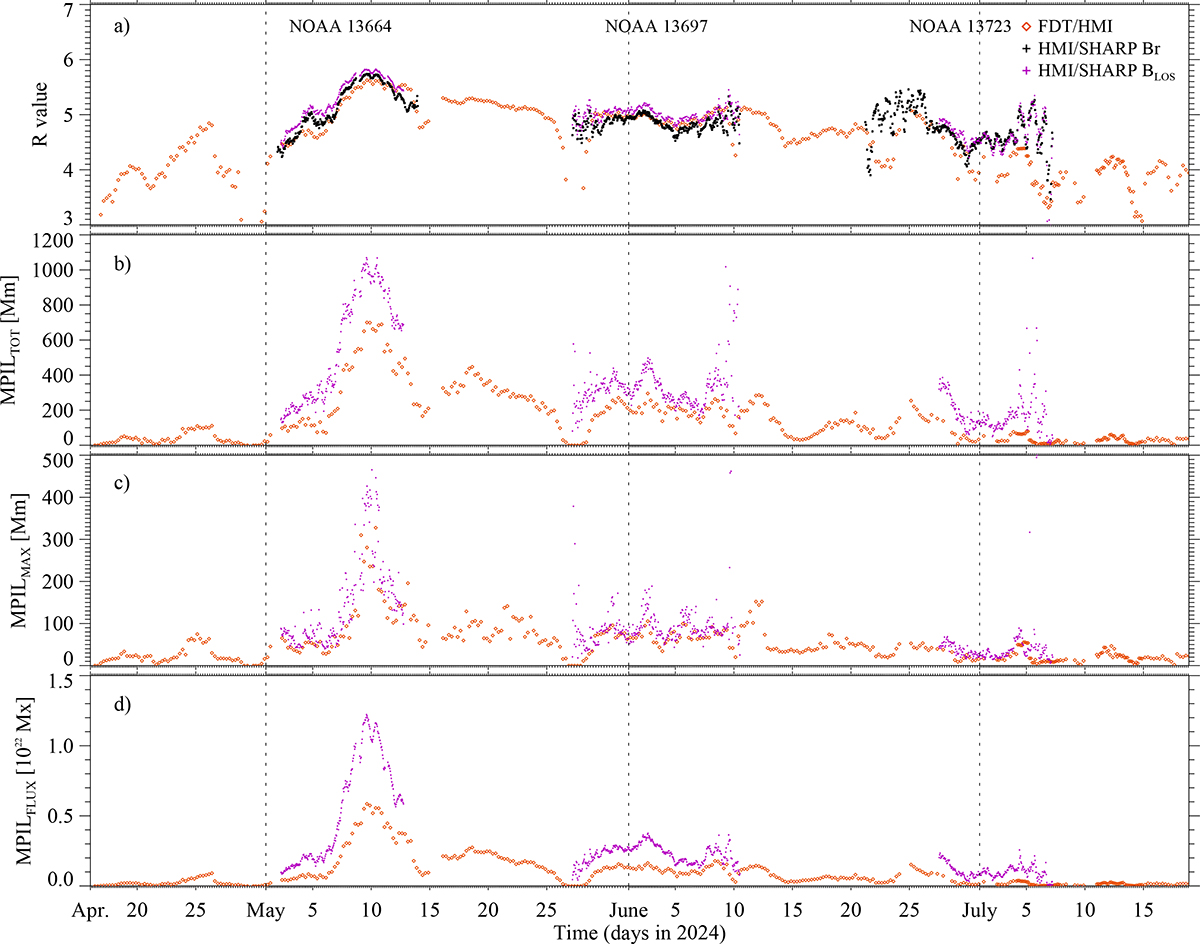
Download original image
Same as Fig. 5, but for (a) the R value calculated from the SHARP Br and BLOS components (black and purple crosses) and from the collated dataset (red diamonds), and (b)–(d) the total length of MPILs, the length of the main MPIL, and the magnetic flux associated with MPILs, calculated from the SHARP BLOS and the collated SDO/HMI – SO/PHI-FDT dataset (purple crosses and red diamonds, respectively). Dashed lines mark the first day of each month, to facilitate a comparison.
Current usage metrics show cumulative count of Article Views (full-text article views including HTML views, PDF and ePub downloads, according to the available data) and Abstracts Views on Vision4Press platform.
Data correspond to usage on the plateform after 2015. The current usage metrics is available 48-96 hours after online publication and is updated daily on week days.
Initial download of the metrics may take a while.