Fig. 10.
Download original image
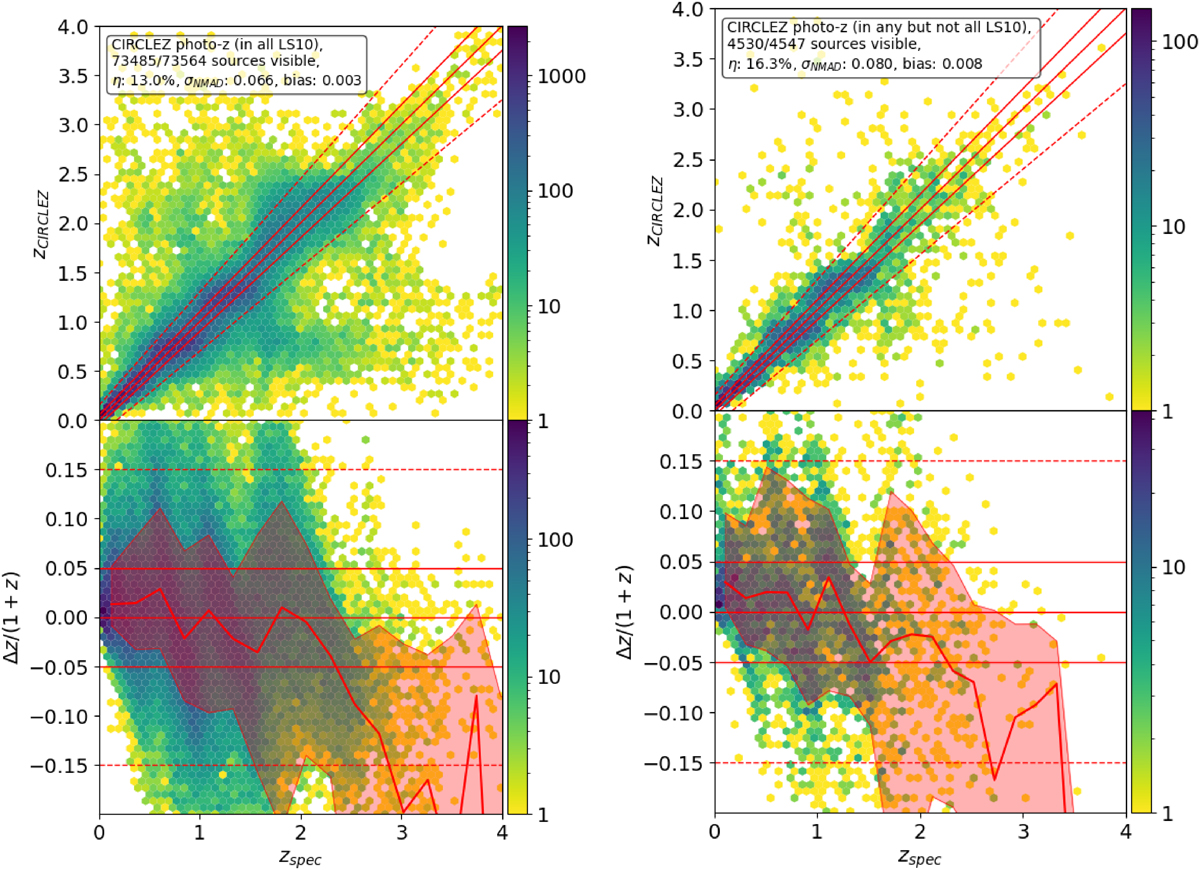
Comparison between photometric and spectroscopic redshifts for sources within (left panels) and outside (right panels) the inAllLS10 area. In the top panel, the lines represent the one-to-one relation and the thresholds adopted to define outliers (see text and footnotes). The bottom panel shows the normalised residuals (zphot − zspec)/(1 + zspec). The red lines in the lower panels indicate the moving medians and the 1 sigma region, revealing a negative bias above redshift 2. See main text for more details.
Current usage metrics show cumulative count of Article Views (full-text article views including HTML views, PDF and ePub downloads, according to the available data) and Abstracts Views on Vision4Press platform.
Data correspond to usage on the plateform after 2015. The current usage metrics is available 48-96 hours after online publication and is updated daily on week days.
Initial download of the metrics may take a while.