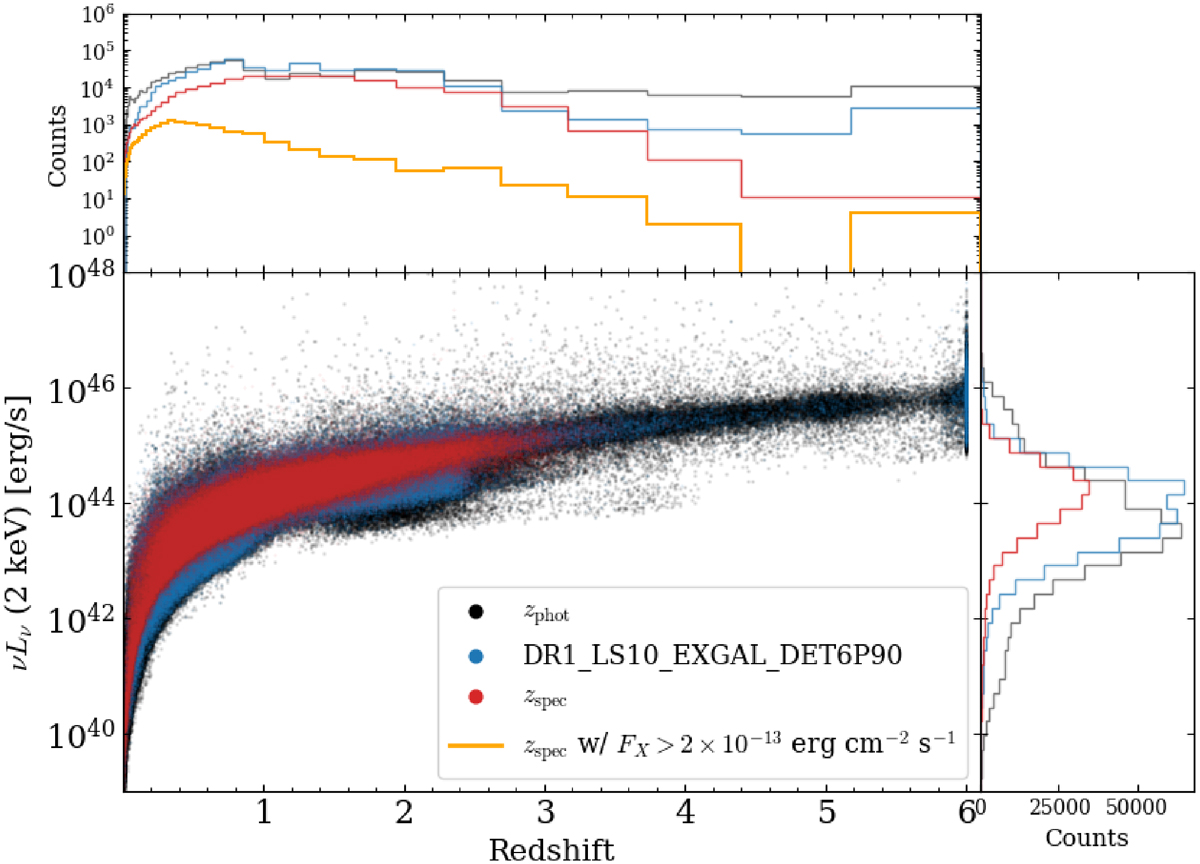
Fig. 12.
Download original image
X-ray (2keV) luminosity-redshift distribution for eRASS1 sources within the LS10 footprint, compared to the same distribution from the high purity and reliability AGN sample DR1_LS10_EXGAL_DET6P90 (blue). Symbols indicate the redshift: spectroscopic (red) and photometric (black). The apparent excess of sources at z = 6 is attributed to unreliable photometric redshift estimates (see Section 6). For completeness, the histogram distributions for the redshift (top) and the X-ray luminosity (right) are also shown. In the redshift distribution we also show, in orange, the spectroscopic distribution for sources at the depth of ROSAT (F0.5 − 2 keV > 2 × 10⁻¹³ erg s−1 cm−2).
Current usage metrics show cumulative count of Article Views (full-text article views including HTML views, PDF and ePub downloads, according to the available data) and Abstracts Views on Vision4Press platform.
Data correspond to usage on the plateform after 2015. The current usage metrics is available 48-96 hours after online publication and is updated daily on week days.
Initial download of the metrics may take a while.