Fig. 16.
Download original image
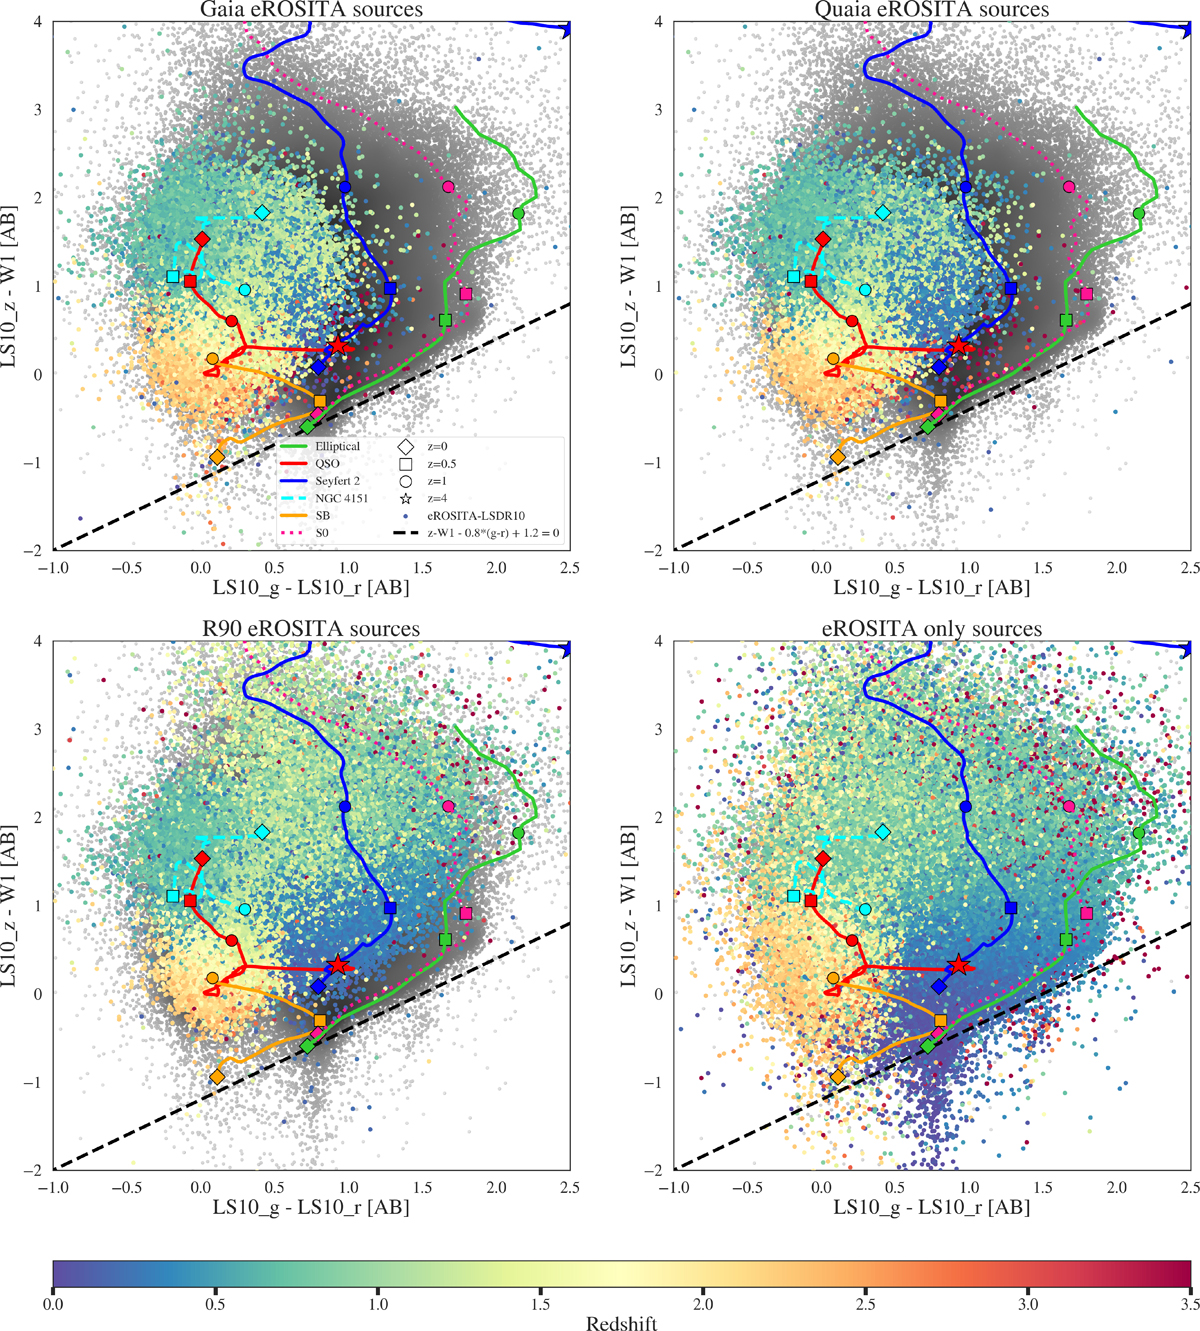
g-r vs z-W1 colour-colour plots for the eROSITA sample DR1_LS10_EXGAL_DET6P90 eROSITA DR1 sources (grey), detected also in Gaia (top left), Quaia (right left), and AllWISE/R90 (bottom left), respectively. The bottom right panel shows the distribution of the sources that are unique to eROSITA DR1. The sources in all panels are colour-coded as a function of redshift. Overlapped are the tracks of a few examples of typical SEDs, which show that many of the sources that are detected only by eROSITA are early-type and Seyfert 2 at redshift below 1.
Current usage metrics show cumulative count of Article Views (full-text article views including HTML views, PDF and ePub downloads, according to the available data) and Abstracts Views on Vision4Press platform.
Data correspond to usage on the plateform after 2015. The current usage metrics is available 48-96 hours after online publication and is updated daily on week days.
Initial download of the metrics may take a while.