Fig. 3.
Download original image
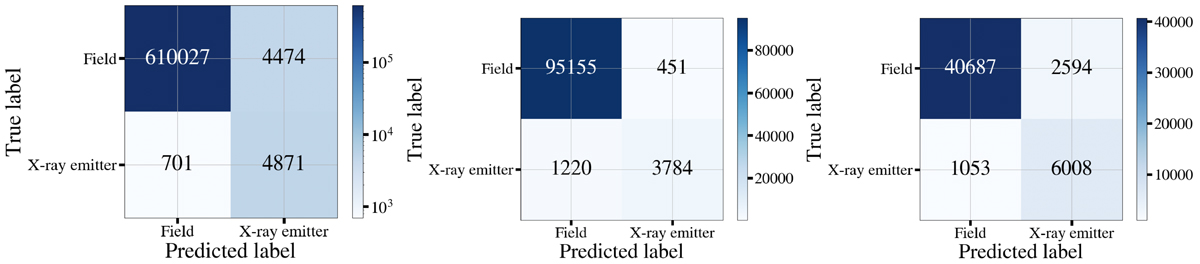
Confusion matrices resulting from the Random Forest classification on the validation test sets are shown for LS10 (left panel), GDR3 (middle panel), and CW2020 (right panel). The colour scale in the panels represents the number of sources per cell, with darker shades indicating higher counts. The entries along the main diagonal (top-left to bottom-right) indicate correctly classified sources. The different total number of sources across the three matrices reflects the variations in survey depth, spatial resolution, and source density among the three surveys.
Current usage metrics show cumulative count of Article Views (full-text article views including HTML views, PDF and ePub downloads, according to the available data) and Abstracts Views on Vision4Press platform.
Data correspond to usage on the plateform after 2015. The current usage metrics is available 48-96 hours after online publication and is updated daily on week days.
Initial download of the metrics may take a while.