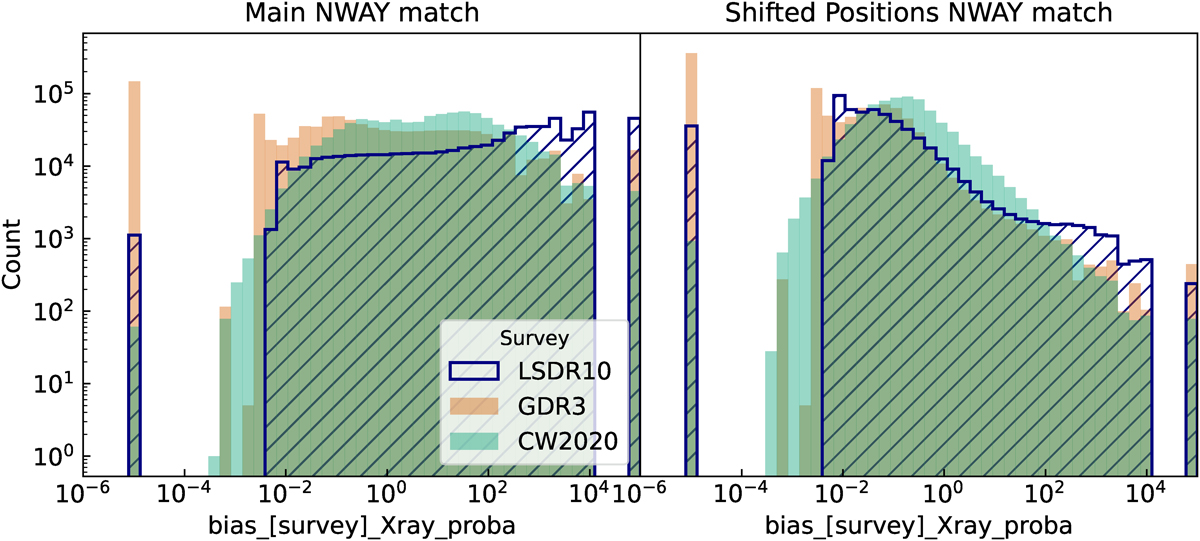
Fig. 4.
Download original image
Histogram distribution of the probability weighting (i.e. bias), introduced by the priors for the LS10, GDR3 and CW2020 counterparts to eRASS1. The left panel shows the distribution of the bias for the actual eRASS1 counterparts, while the right panel displays the distribution for counterparts to the eRASS1 shifted positions. A value of 1 indicates no change in the probability of being the right counterpart, i.e. the probability is based solely on the distance to the X-ray position, positional uncertainties, and source number densities. Values above(below) 1 indicate that the prior has degraded(reinforced) the probability. Almost 50% of the counterparts from GDR3 got degraded, after considering the prior. More details in the main text (Section 3.1.2).
Current usage metrics show cumulative count of Article Views (full-text article views including HTML views, PDF and ePub downloads, according to the available data) and Abstracts Views on Vision4Press platform.
Data correspond to usage on the plateform after 2015. The current usage metrics is available 48-96 hours after online publication and is updated daily on week days.
Initial download of the metrics may take a while.