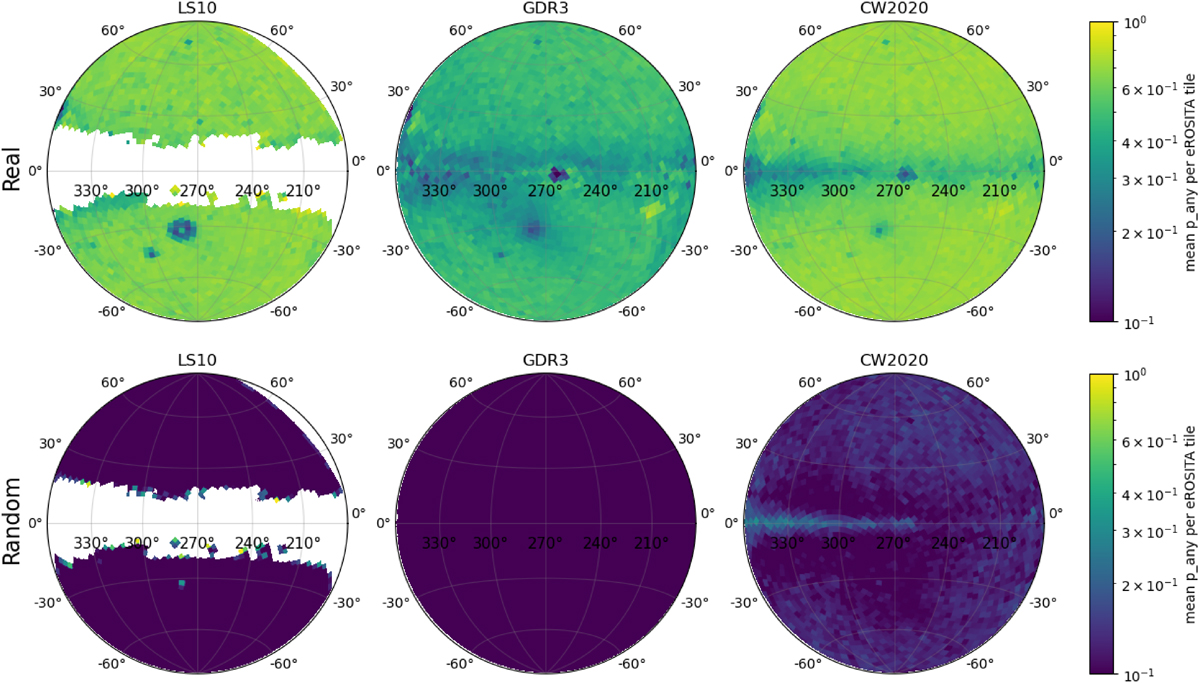
Fig. 5.
Download original image
Mean p_any distribution per eROSITA tile for real (top) and random (bottom row) eROSITA coordinates, using ancillary data from LS10 (left), GDR3 (middle) and CW2020 (right). The colour scale is consistent across all panels to facilitate comparison. While the p_any values for the real sources are generally higher than those for the random positions, they can approach similar levels in regions of high source density, indicating an increased risk of chance associations (see the main text for further discussions).
Current usage metrics show cumulative count of Article Views (full-text article views including HTML views, PDF and ePub downloads, according to the available data) and Abstracts Views on Vision4Press platform.
Data correspond to usage on the plateform after 2015. The current usage metrics is available 48-96 hours after online publication and is updated daily on week days.
Initial download of the metrics may take a while.