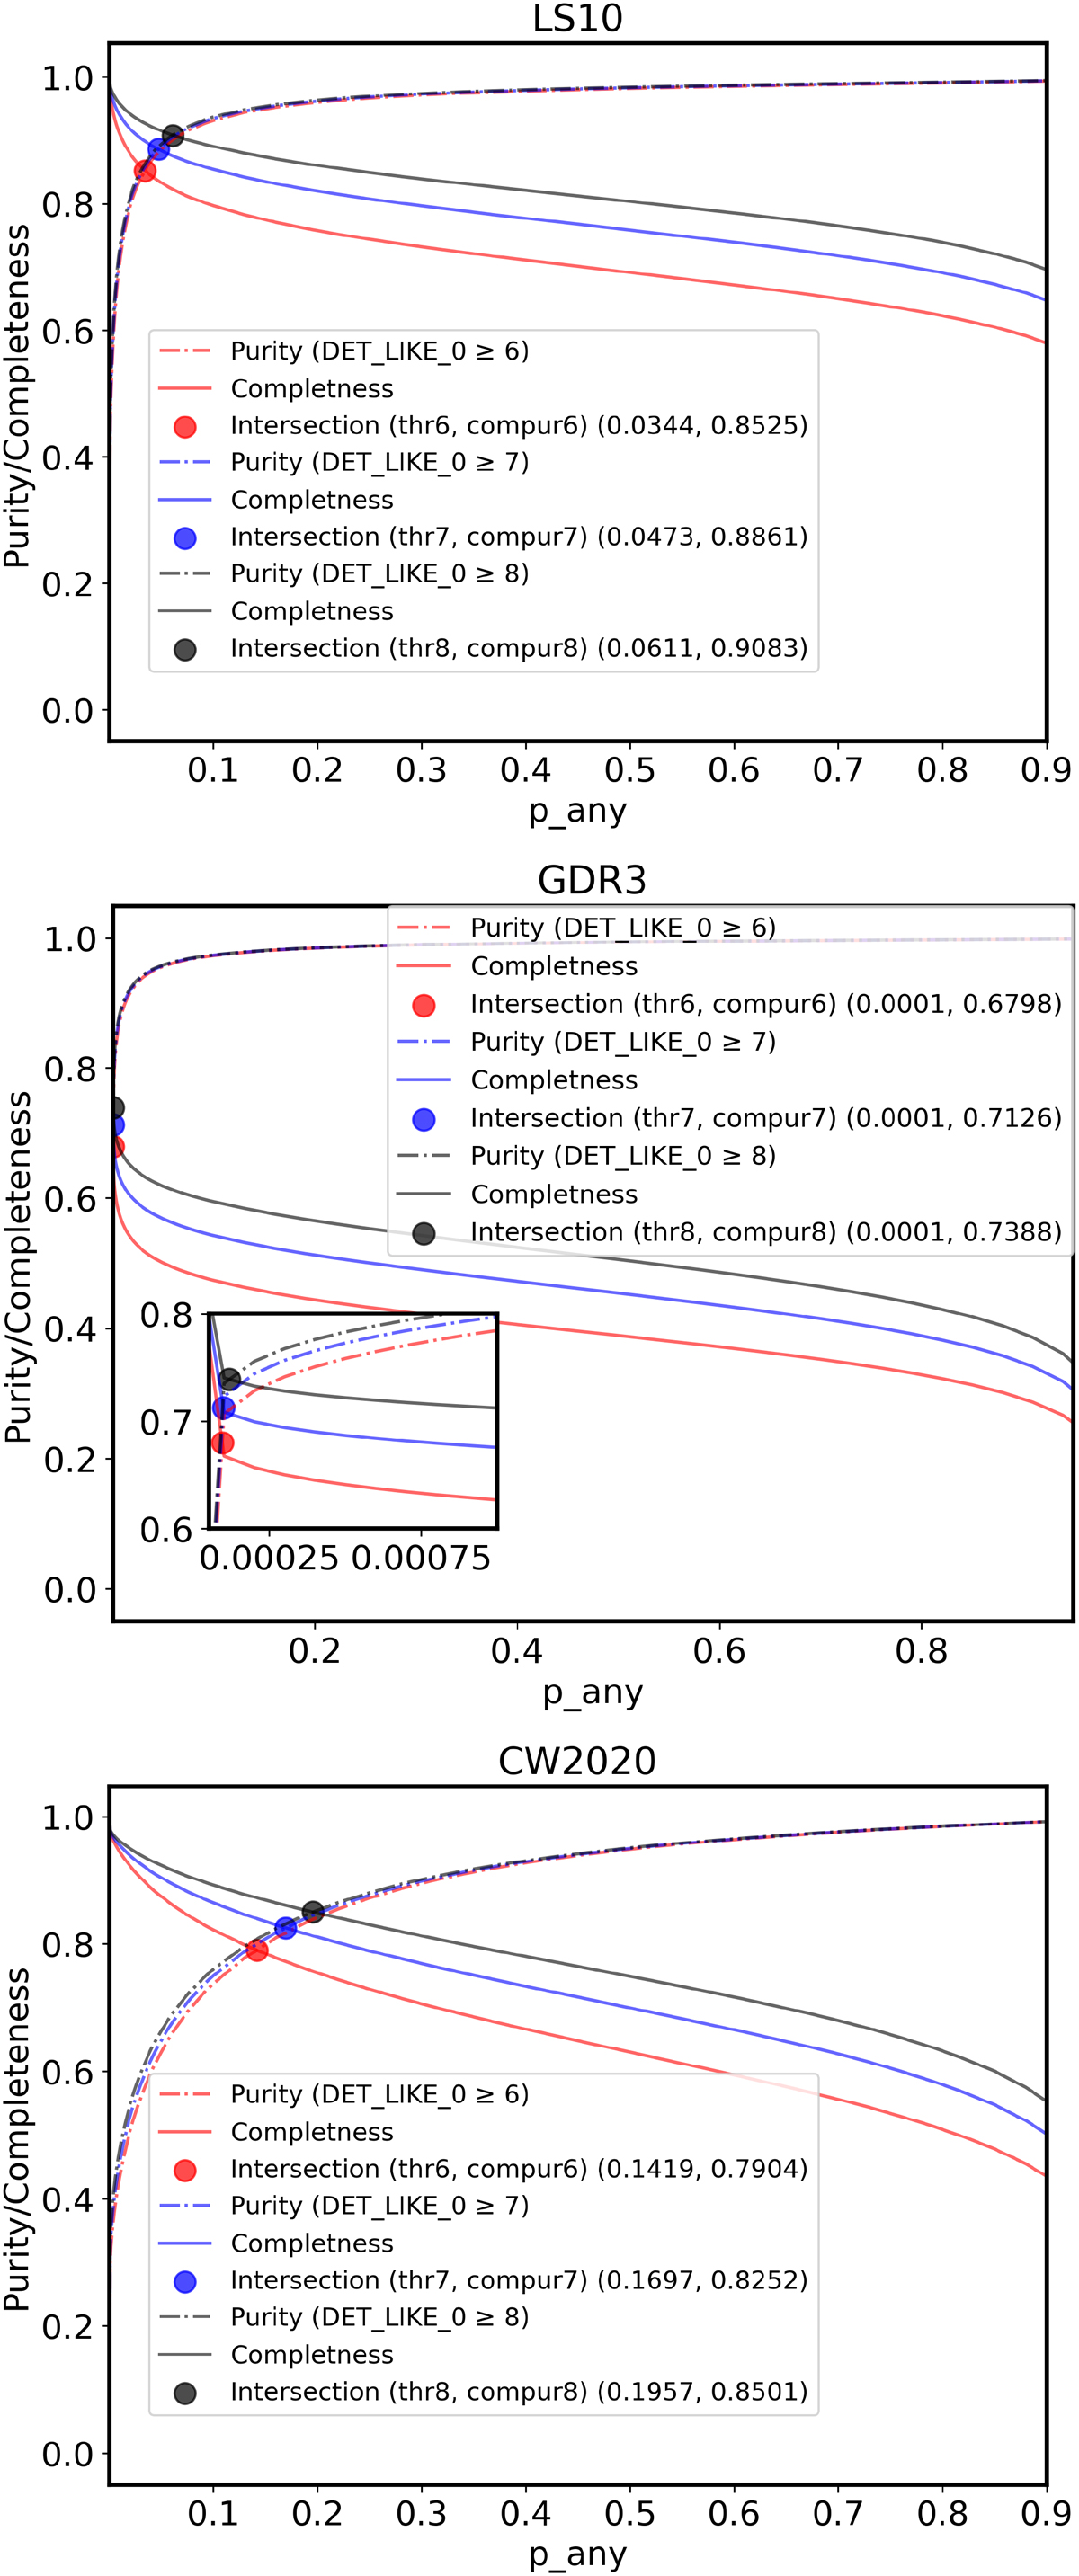
Fig. 6.
Download original image
Mean purity and completeness as a function of p_any for LS10, GDR3, and CW2020, averaged over their respective surveys’ footprints (i.e. considering eROSITA sources outside the Galactic plane in the case of LS10). Different colours indicate different detection likelihood thresholds (DET_LIKE_0) for the eROSITA sources. The catalogues include the p_any thresholds and the completeness/purity intersection averaged compur[6,7,8] computed per eROSITA tile as a function of DET_LIKE_0.
Current usage metrics show cumulative count of Article Views (full-text article views including HTML views, PDF and ePub downloads, according to the available data) and Abstracts Views on Vision4Press platform.
Data correspond to usage on the plateform after 2015. The current usage metrics is available 48-96 hours after online publication and is updated daily on week days.
Initial download of the metrics may take a while.