Fig. 1.
Download original image
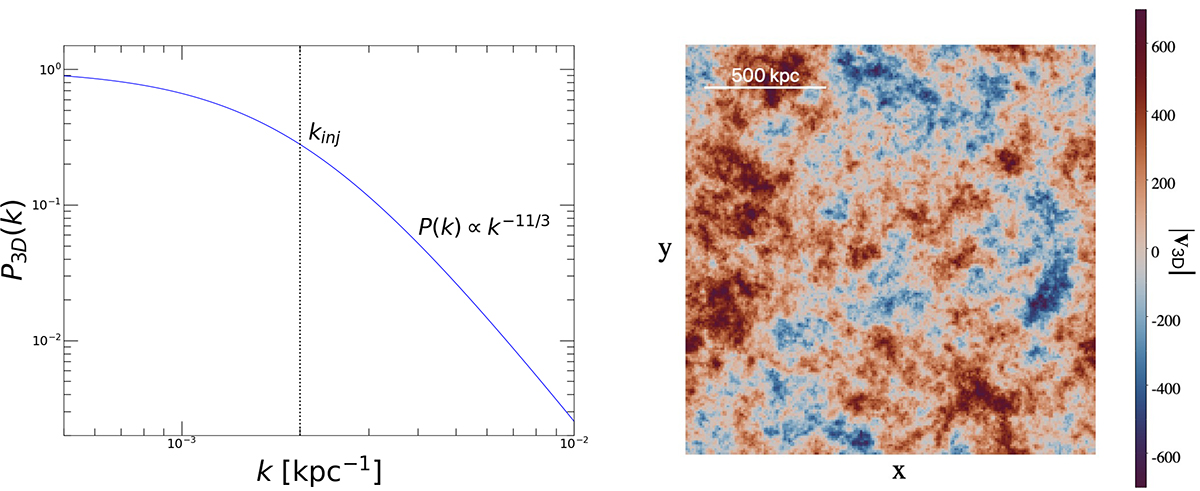
Example of fluctuation field generation. Left: Model 3D power spectrum described by an injection at kinj and a classical Kolmogorov cascade on smaller scales (Eq. 4). The vertical dashed line shows the position of kinj = (500 kpc)−1. Right: Slice of the real-space velocity fluctuation field along the z axis generated from this power spectrum (Eq. 3) for a velocity dispersion σv = 300 km/s. The color code shows the velocity in km/s. The box size is 1.7 Mpc on a side.
Current usage metrics show cumulative count of Article Views (full-text article views including HTML views, PDF and ePub downloads, according to the available data) and Abstracts Views on Vision4Press platform.
Data correspond to usage on the plateform after 2015. The current usage metrics is available 48-96 hours after online publication and is updated daily on week days.
Initial download of the metrics may take a while.