Fig. 3.
Download original image
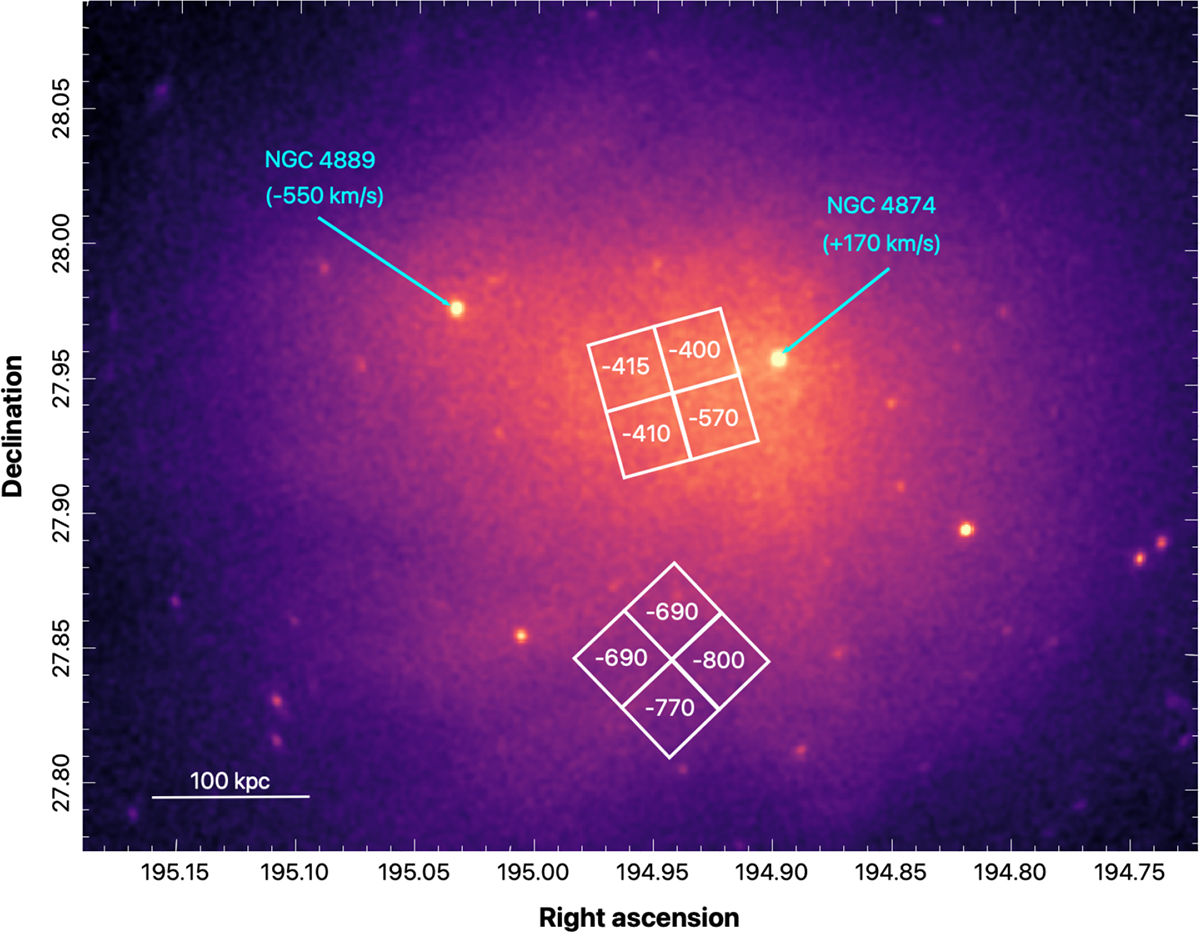
Location of the XRISM/Resolve measurements superimposed on a XMM-Newton/EPIC surface brightness map of the Coma cluster. The white squares show the footprint of the two Resolve pointings split into four individual quadrants, with the number showing the bulk velocity of each region with respect to the cluster rest frame. The blue arrows show the positions of the two dominant galaxies NGC 4874 and NGC 4889 with their respective peculiar velocities. Figure reproduced with modifications from X25.
Current usage metrics show cumulative count of Article Views (full-text article views including HTML views, PDF and ePub downloads, according to the available data) and Abstracts Views on Vision4Press platform.
Data correspond to usage on the plateform after 2015. The current usage metrics is available 48-96 hours after online publication and is updated daily on week days.
Initial download of the metrics may take a while.